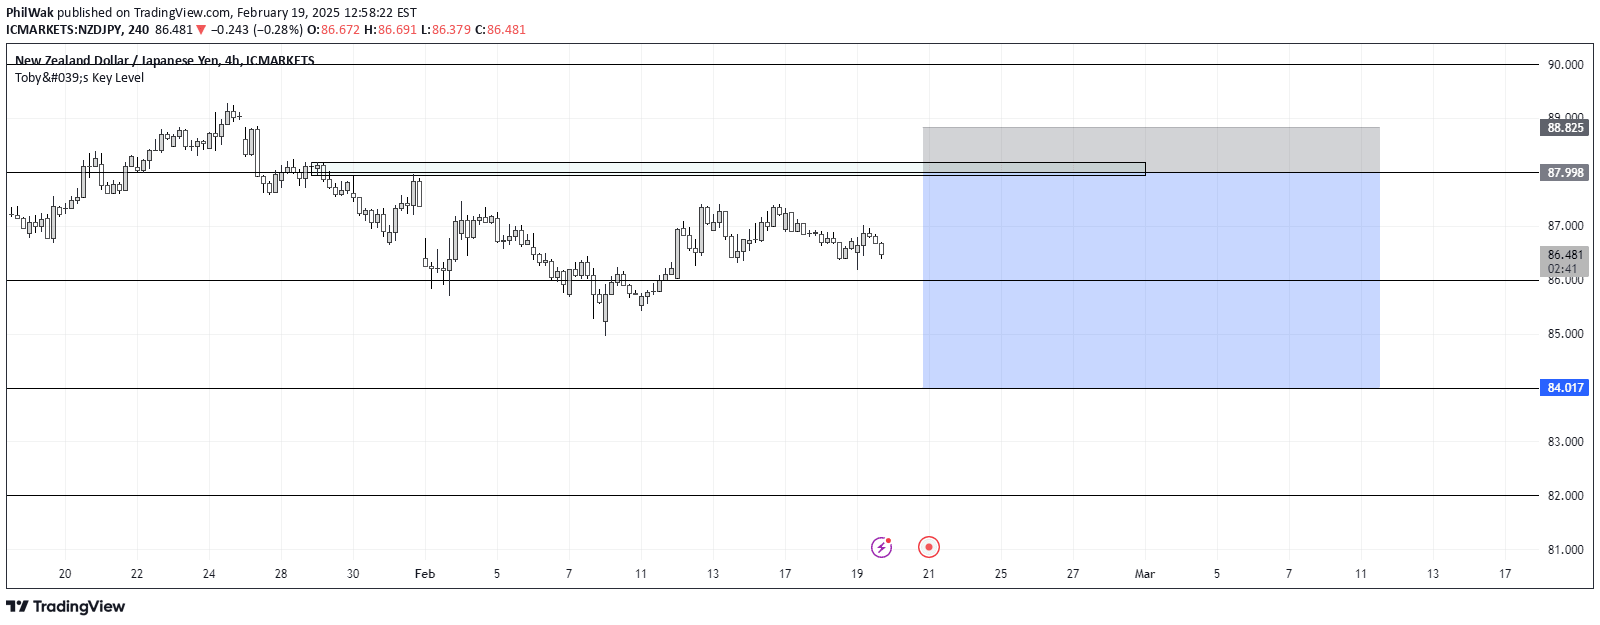
A trading indicator that sets automated price targets based on percentage drops from the current dollar-cost averaging (DCA) price, providing strategic entry points for traders.
Explore complementary indicator rolesHow it works
The indicator operates by establishing dynamic price targets when the asset's price falls from the current DCA price. It automatically sets new targets at predefined percentage drops, with a default configuration of 10 targets covering potential price declines up to 71 percent.
Traders can customize the number of price targets and corresponding percentage drops to suit their specific risk management strategy. The flexible design allows for personalized configuration while maintaining a systematic approach to identifying potential buying opportunities during market downturns.
Why it may be useful
This indicator provides traders with a structured method for managing potential dollar-cost averaging opportunities during market corrections. By predetermining price targets, investors can make more rational and unemotional decisions about additional asset purchases.
The systematic approach helps traders overcome psychological barriers during market volatility, enabling them to potentially lower their average entry price and manage risk more effectively. It transforms market dips from potential threats into strategic investment opportunities.
When to explore it
The price target indicator is most effective in volatile markets with potential for significant price corrections. It is particularly useful for long-term investors who employ dollar-cost averaging strategies and want a systematic approach to adding to their positions.
Traders should use this indicator in markets with established trends and when they have a strong conviction about the long-term potential of an asset. It works best when combined with other fundamental and technical analysis tools to validate potential entry points.
Keep exploring
What we’ve verified
Access, alerts and repainting behaviour have not been independently verified for this indicator. Check the creator’s current publication and settings.
General descriptions and classifications are recovered research. Verified details above identify the specific checks we have completed. Check the creator’s current publication for later changes.