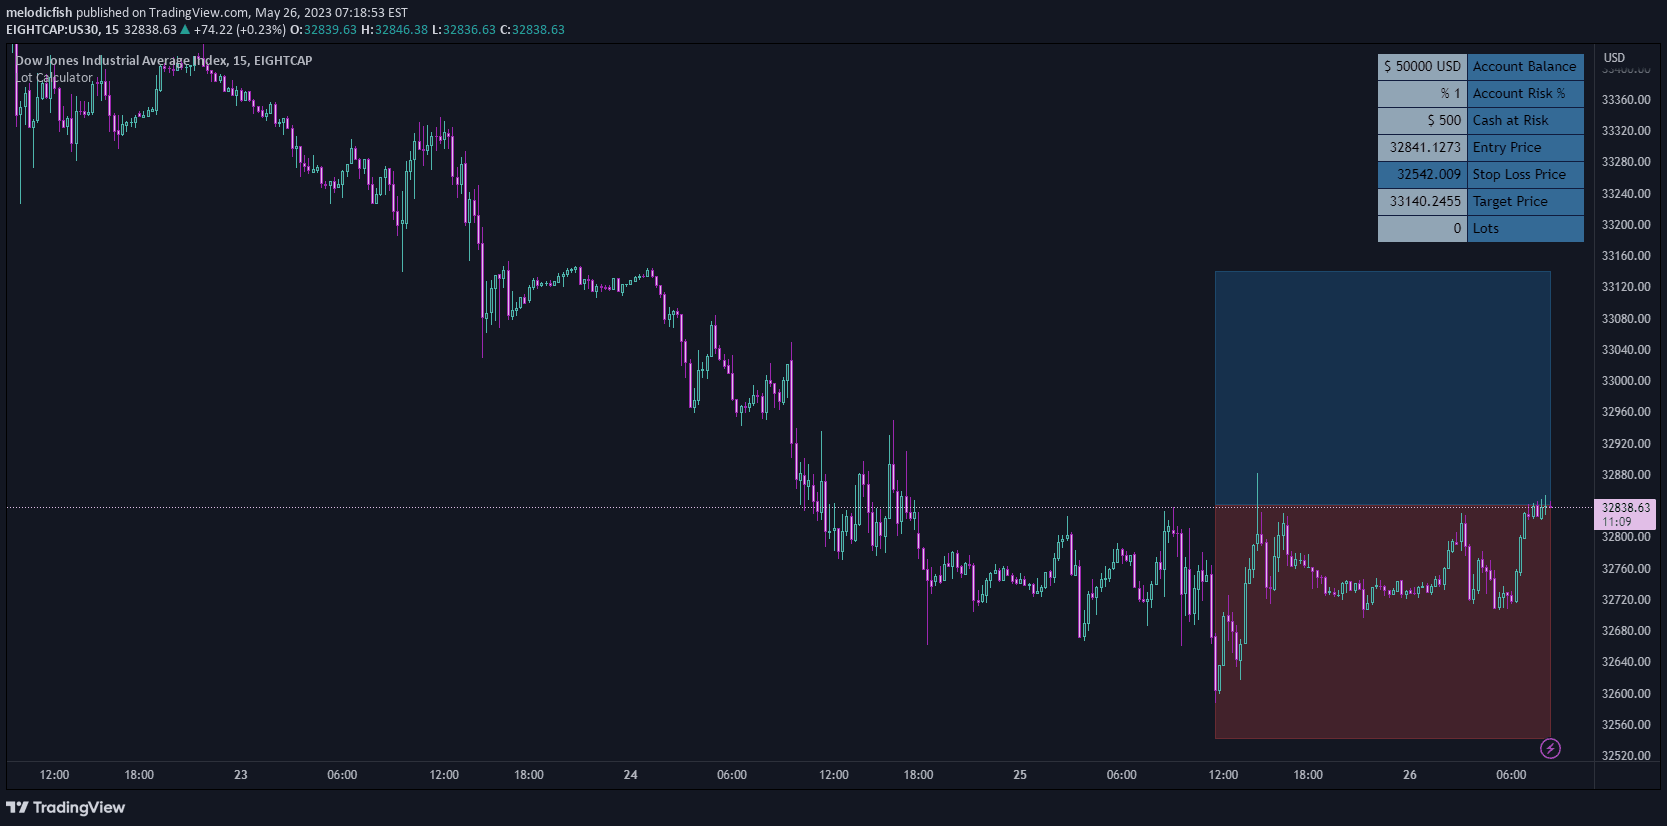
A computational tool designed to track and quantify potential profits and losses by measuring drawdown and run-up from order opening and closing points.
Explore complementary indicator rolesHow it works
The drawdown and run-up calculation tool analyzes price movements from the point of order execution, tracking the maximum potential profit or loss experienced during a trading position. It dynamically calculates the peak and trough points of the trade, providing traders with a clear visualization of the position's performance relative to its entry point.
The tool considers each symbol's minimum tick value to ensure precise measurements, adapting its calculations to the specific trading instrument. By continuously monitoring the price fluctuations, it helps traders understand the potential range of their trade's performance and gain insights into the market's volatility and their position's potential trajectory.
Why it may be useful
Understanding drawdown and run-up is crucial for risk management and performance evaluation in trading. By providing a clear metric of potential profits and losses, traders can make more informed decisions about position sizing, stop-loss placement, and overall trading strategy.
The tool offers traders a transparent view of their trade's potential range, helping them assess the risk-reward ratio more effectively. It enables traders to identify the maximum potential gain or loss at any given moment, which is essential for developing disciplined trading approaches and maintaining emotional control during market fluctuations.
When to explore it
This tool is most effective during volatile market conditions where price movements can be significant and rapid. Traders engaged in active trading strategies, such as scalping and day trading, will find the drawdown and run-up calculation particularly useful for real-time performance assessment.
The tool is especially valuable when trading instruments with high volatility or during news events and market announcements. Traders can use it to monitor potential profit and loss ranges, adjust their risk management strategies, and gain a more comprehensive understanding of their trading performance across different market scenarios.
Keep exploring
What we’ve verified
Access, alerts and repainting behaviour have not been independently verified for this indicator. Check the creator’s current publication and settings.
General descriptions and classifications are recovered research. Verified details above identify the specific checks we have completed. Check the creator’s current publication for later changes.