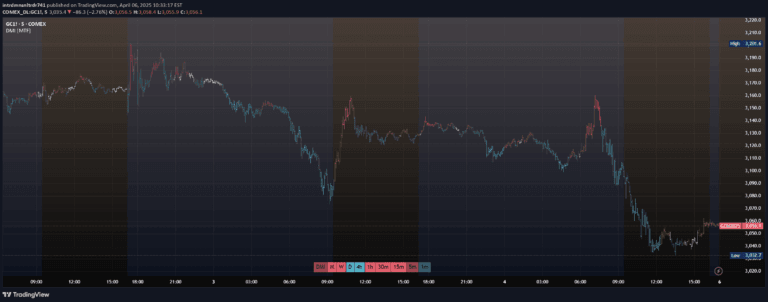
An advanced volatility indicator that calculates Average True Range (ATR) and provides dynamic insights into market movement, helping traders assess and time their trades effectively.
Explore complementary indicator rolesHow it works
The indicator calculates key volatility metrics by analyzing price ranges and true range across multiple bars. It first computes the Average True Range (ATR) over a specified period, typically 14 bars, which measures the average price movement accounting for gaps and limit moves.
Additionally, the indicator tracks the average and maximum price ranges over a configurable number of bars, providing traders with insights into potential market movement. It then calculates the average number of bars required to achieve a significant price move and suggests a recommended maximum holding period for trades based on historical volatility patterns.
Why it may be useful
Volatility indicators are crucial for traders because they provide a quantitative measure of market uncertainty and potential price movement. By understanding the average range and typical movement duration, traders can make more informed decisions about entry, exit, and position sizing.
This indicator helps traders avoid overholding losing positions and provides a systematic approach to managing trade duration. It offers a time-based complement to traditional price-based stop-loss strategies, enabling more dynamic and adaptive trading approaches across different market conditions and timeframes.
When to explore it
This volatility indicator is most effective when traders want to assess market conditions before entering a trade. It works particularly well in markets with consistent volatility patterns, such as major currency pairs, stock indices, and liquid commodities.
Traders should use this tool when they need to understand potential price movement duration and set realistic expectations for trade holding periods. It is especially valuable during periods of changing market volatility, helping traders adjust their strategies to current market conditions and avoid prolonged, unproductive trade positions.
Keep exploring
What we’ve verified
Access, alerts and repainting behaviour have not been independently verified for this indicator. Check the creator’s current publication and settings.
General descriptions and classifications are recovered research. Verified details above identify the specific checks we have completed. Check the creator’s current publication for later changes.