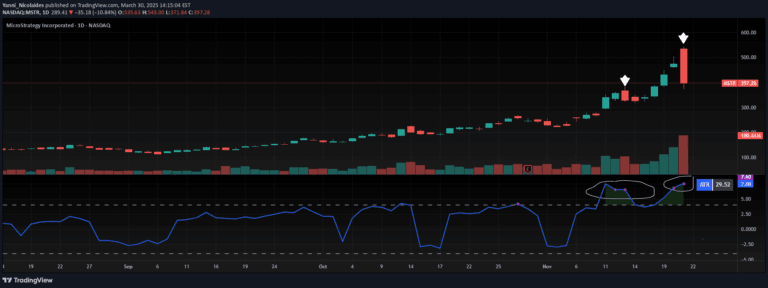
ADR Table is a custom indicator that calculates Average Daily Range across multiple timeframes, helping traders understand price volatility and identify potential trading opportunities.
Explore complementary indicator rolesHow it works
The ADR Table calculates the Average Daily Range by measuring the price movement across Daily, 4-Hour, and 1-Hour timeframes. It dynamically tracks and displays the maximum range of price movement during each specified period, creating visual markers on the trading chart.
By analyzing historical price data, the indicator automatically computes the typical price range for each timeframe, helping traders understand potential market movement boundaries. The tool provides real-time updates, allowing traders to see current price action in relation to the calculated average ranges.
Why it may be useful
The ADR Table is crucial for traders seeking to understand market volatility and potential price movement boundaries. By providing clear visual representations of price ranges, traders can make more informed decisions about entry and exit points, risk management, and potential trade opportunities.
Understanding the Average Daily Range helps traders set realistic profit targets, manage stop-loss levels, and develop more precise trading strategies. The multi-timeframe approach allows for a comprehensive view of market behavior across different trading sessions.
When to explore it
The ADR Table is most effective during periods of consistent market activity, particularly for traders focusing on intraday and short-term trading strategies. It works best in liquid markets with predictable volatility patterns, such as major forex pairs, stock indices, and commodities.
Traders should utilize this indicator when seeking to understand potential price movement ranges, identify high-probability entry and exit points, and develop a more systematic approach to trading. It is particularly useful for scalpers and day traders who need precise insights into market volatility.
Keep exploring
What we’ve verified
Access, alerts and repainting behaviour have not been independently verified for this indicator. Check the creator’s current publication and settings.
General descriptions and classifications are recovered research. Verified details above identify the specific checks we have completed. Check the creator’s current publication for later changes.