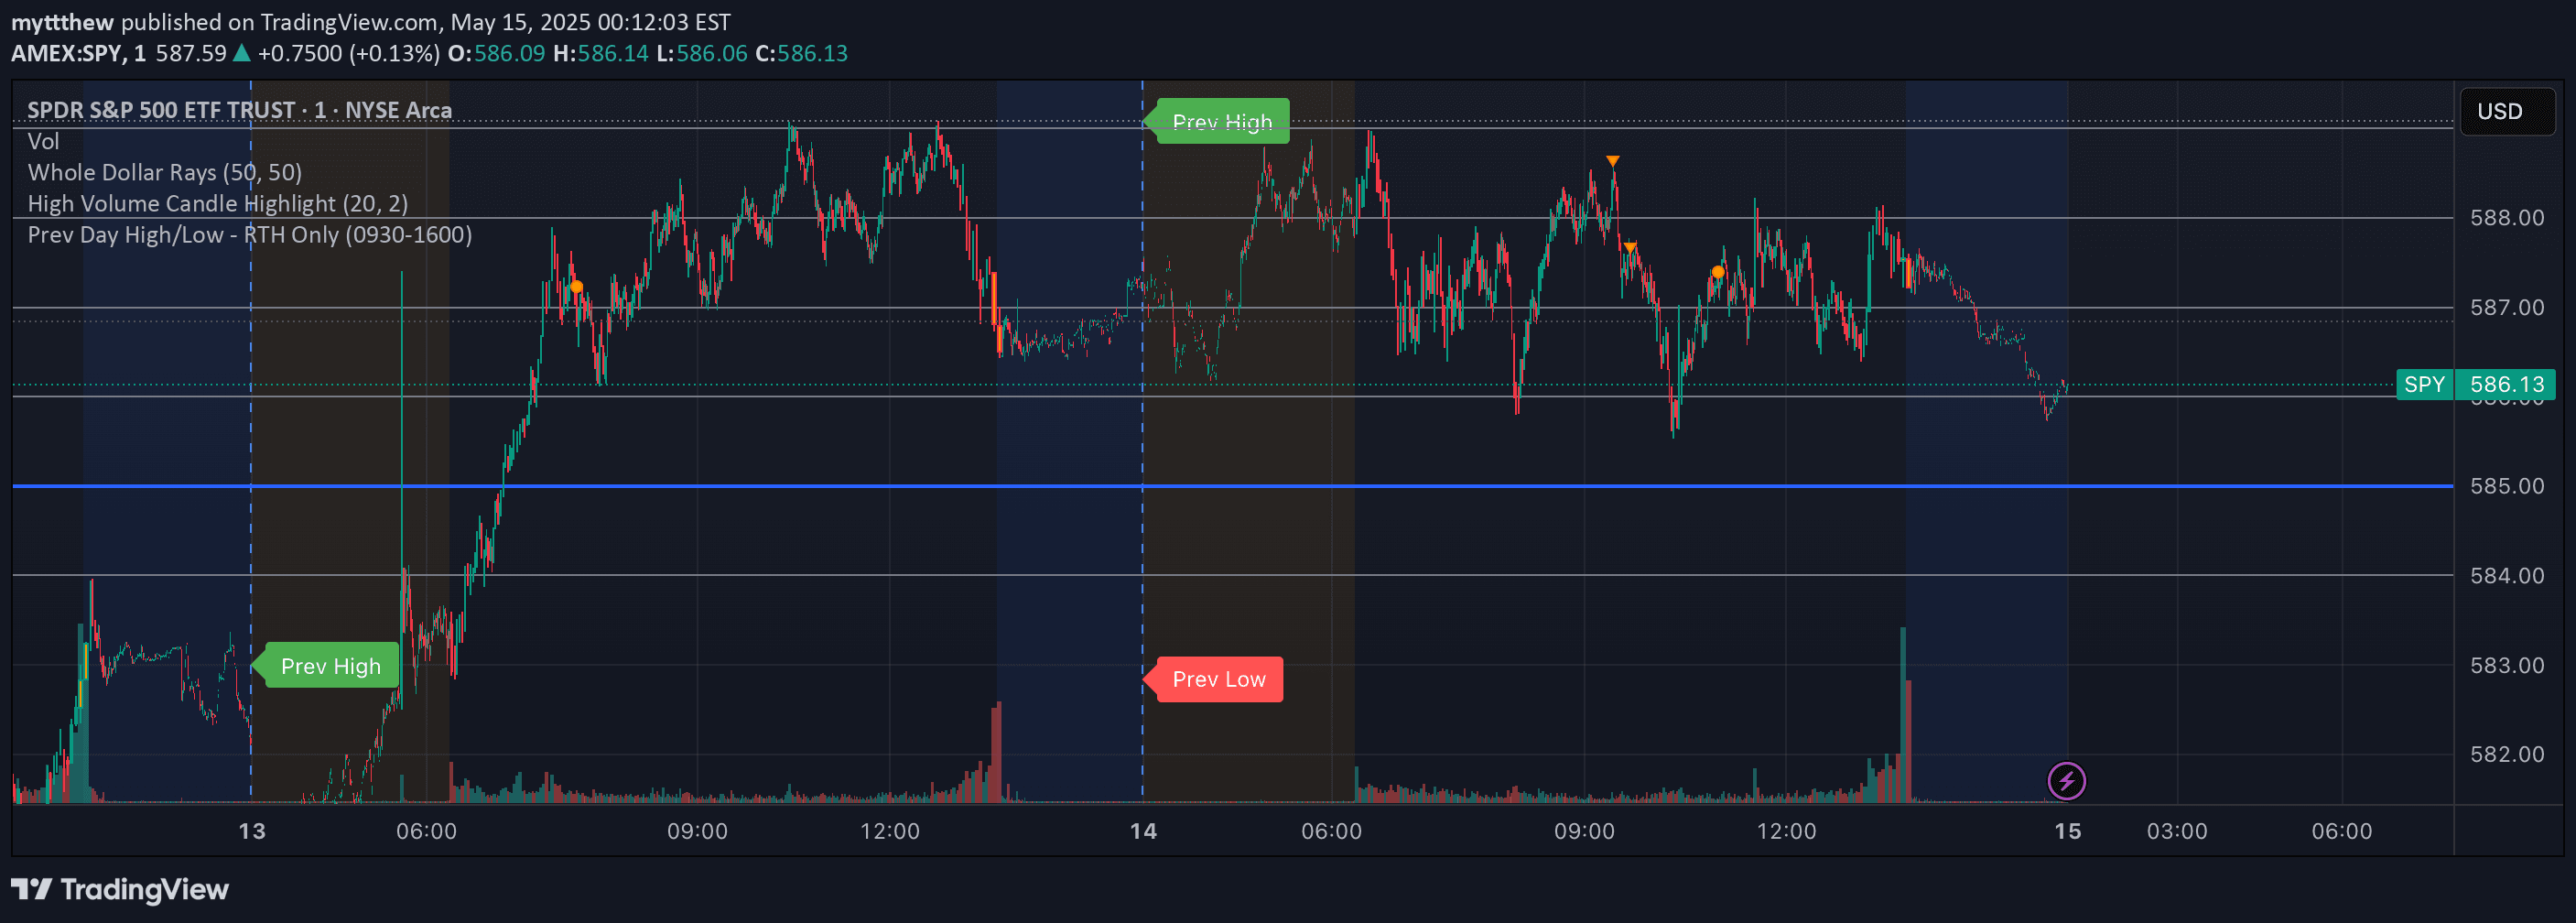
Real-time Daily Average Daily Range (ADR) indicator that tracks price range volatility, comparing current session movement to historical averages with customizable settings.
Explore complementary indicator rolesHow it works
The Daily ADR Table Indicator calculates the current trading session's price range as a percentage, comparing it to a historical average typically based on the last 20 trading days. It uses session-based calculations to track real-time volatility, ensuring accurate and up-to-date measurements throughout the trading period.
The indicator automatically computes percentages and allows customization of the historical average period from 1 to 500 days. By displaying both current and historical ranges in an easily readable format, traders can quickly assess whether the current market movement is within expected volatility levels.
Why it may be useful
The Daily ADR Table Indicator provides traders with critical real-time insights into market volatility, enabling more informed trading decisions. By presenting volatility metrics in a clear, percentage-based format, it helps traders understand the current market conditions relative to historical performance, which is essential for risk management and strategy development.
This tool is particularly valuable because it transforms complex volatility data into an easily digestible visual representation. Traders can quickly determine whether the current price movement is typical or unusual, supporting more precise position sizing, stop-loss placement, and overall trade planning.
When to explore it
The Daily ADR Table Indicator is most effective during active trading sessions when real-time volatility assessment is crucial. It is particularly useful for day traders and swing traders who need to make quick decisions based on current market dynamics and historical volatility patterns.
Traders should utilize this indicator when evaluating potential trade entries, assessing market conditions, and determining appropriate position sizes. It is especially helpful during periods of market uncertainty, potential breakouts, or when comparing current market behavior against typical historical ranges.
Keep exploring
What we’ve verified
Access, alerts and repainting behaviour have not been independently verified for this indicator. Check the creator’s current publication and settings.
General descriptions and classifications are recovered research. Verified details above identify the specific checks we have completed. Check the creator’s current publication for later changes.