YOUR INDICATOR RESEARCH STARTS HERE

Find the right indicator.
Understand what it does.

Explore 11,183 indicators. Filter beyond the obvious.
Discover the tools that fit the way you trade.

THE INDICATOR LIBRARY

Results for “ADR”

11,183 tools to explore

77 indicators matching your filters
Save search
TrendMomentumEditor’s pick

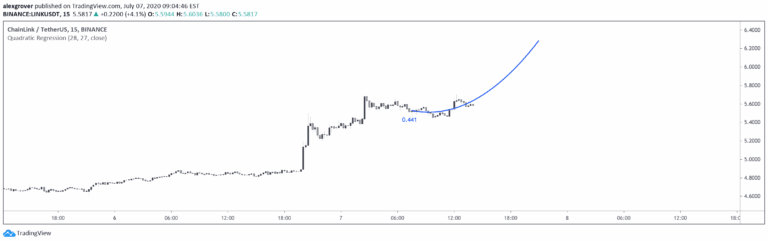
Quadratic Regression

by alexgrover

A quadratic regression indicator that fits a parabolic curve to price data, allowing traders to analyze non-linear trends and potentially forecast future price movements.

Main price chart · unverifiedDay Trading · Swing Trading
Explore
2.5Klikes45.8Kviews81comments
Save
MomentumSignalVolatility

Simple Range

by finallynitin

A comprehensive indicator analyzing daily price range, volatility compression, and trading opportunities through NR7, WR20, TTM Squeeze, and Average Daily Range metrics.

Separate pane · unverifiedScalping · Day Trading
Explore
1.5Klikes19Kviews3comments
Save
Risk ManagementSignal

Futures Risk Calculator

by padrerinat

A trading tool that calculates optimal contract size based on account size, risk percentage, and stop loss, helping traders manage risk and protect capital effectively.

Main price chart · unverifiedScalping · Day Trading
Explore
671likes11.6Kviews14comments
Save
LevelsSignalVolatility

The Vet [TFO]

by tradeforopp

A trading signal that analyzes price ranges using statistical measures, tracking defining range (DR) and projection levels to predict potential price movements and market behavior.

Separate pane · unverifiedScalping · Day Trading
Explore
543likes8.3Kviews5comments
Save
SignalLevels

DR IDR Trading Areas [CHE]

by chervolino

A custom trading indicator that identifies average price movements across different trading periods, using time-based averages to create dynamic support and resistance lines.

Main price chart · unverifiedScalping · Day Trading
Explore
498likes13.1Kviews13comments
Save
LevelsVolatility

ADR % Ranges

by GoodGains

An indicator that calculates average daily range percentages to help traders identify price movement boundaries and potential trading targets based on historical price performance.

Main price chart · unverifiedScalping · Day Trading
Explore
438likes11.3Kviews4comments
Save
LevelsTrendVolatility

ATR Pivots

by tradeblinks

A comprehensive technical analysis tool using Average True Range and Fibonacci levels to identify key support and resistance zones, trend direction, and potential trading opportunities.

Main price chart · unverifiedScalping · Day Trading
Explore
384likes10Kviews1comments
Save
TrendVolatilitySignal

ALEX - ATR Extensions + ADR + Table

by Alex_PrimeTrading

A comprehensive volatility analysis tool that combines ATR, ADR, and moving average metrics to assess price action, market momentum, and potential trading opportunities across different market conditions.

Main price chart · unverifiedScalping · Day Trading
Explore
360likes5.4Kviews0comments
Save
LevelsSignalTrend

Kernel Regression Ribbon

by alphaXiom

Kernel Regression Ribbon is an advanced trend identification tool using multiple kernel regressions to visualize support, resistance, and price movement adaptively.

Main price chart · unverifiedScalping · Day Trading
Explore
324likes9.4Kviews7comments
Save
OscillatorSignalVolume

Enhanced Volume by SR7

by SidRC007

An advanced volume indicator that provides detailed volume analysis with color-coded volume bars, moving average insights, and unique volume labeling for comprehensive market trend assessment.

Separate pane · unverifiedScalping · Day Trading
Explore
308likes5.6Kviews5comments
Save

Likes, views, and comments are historical TradingView snapshots. They describe attention, not trading performance.

START WITH A QUESTION

A little less searching.
A lot more understanding.

Tell DeepAlpha what you need. Get an explanation, a shortlist,
and a direct path to the indicators behind it.

Ask DeepAlpha