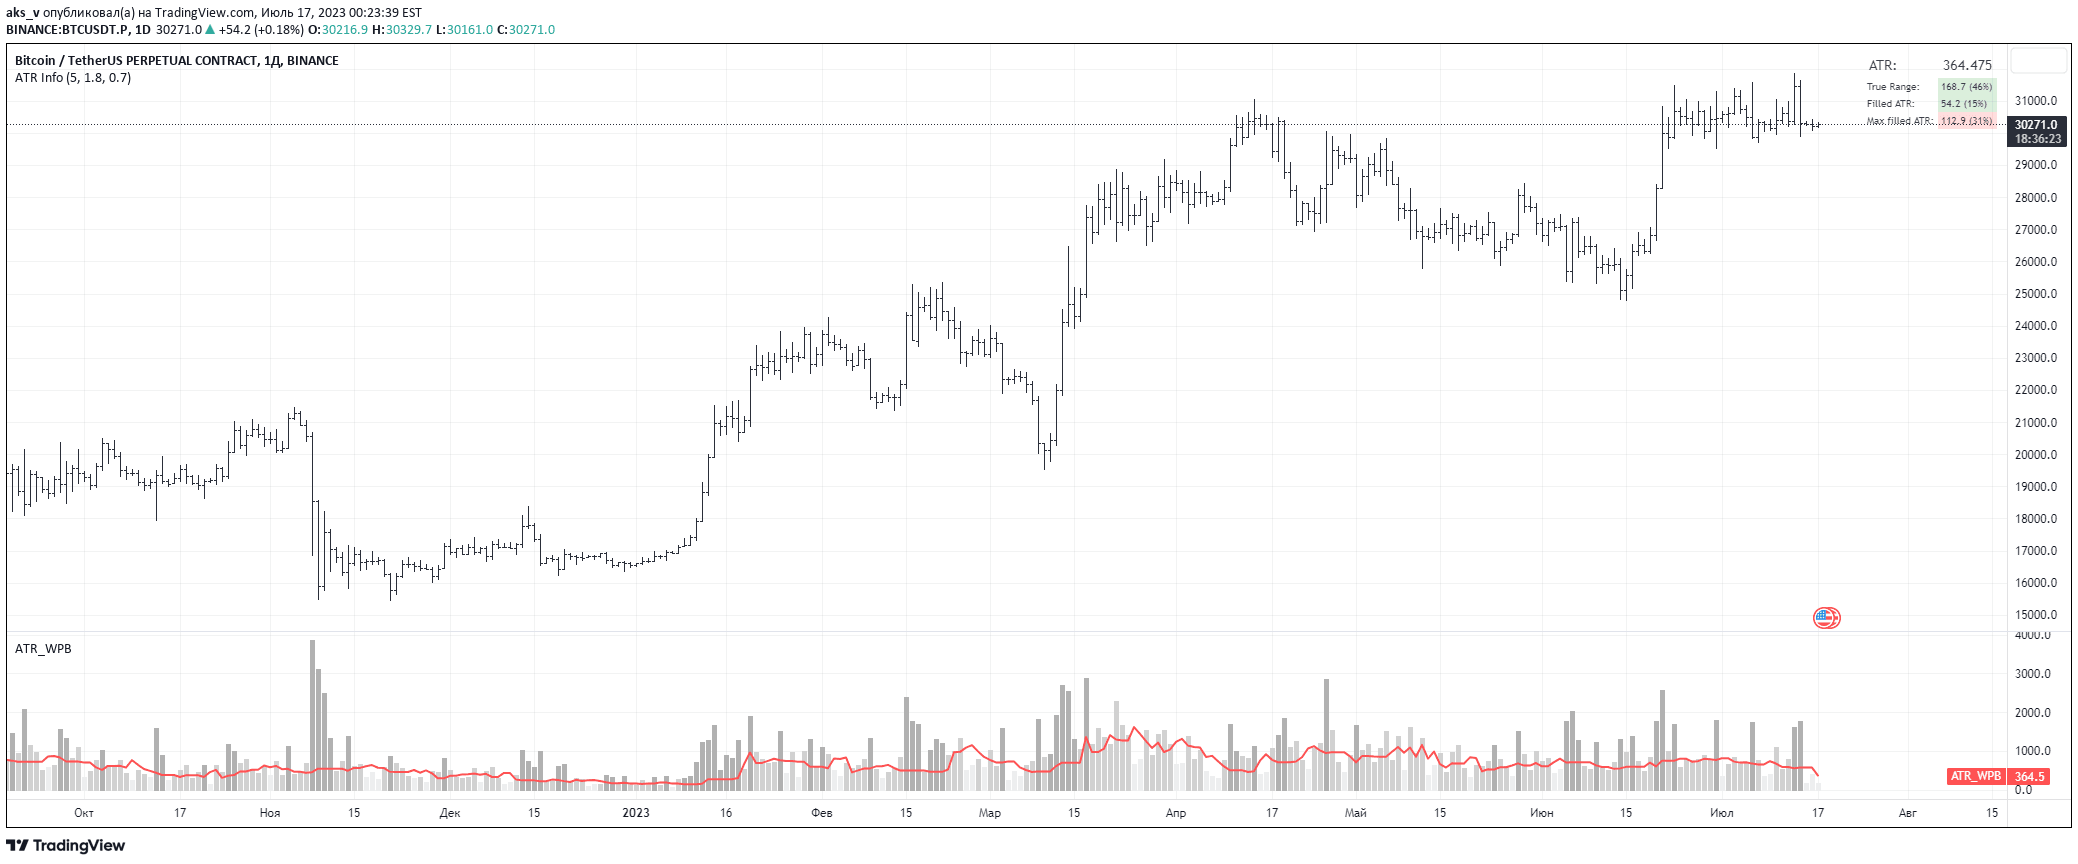
The ATR in Days signal tracks stock price movements relative to Average True Range, helping traders identify extreme volatility zones and potential trading opportunities across multiple timeframes.
Explore complementary indicator rolesHow it works
The ATR in Days signal calculates the average true range of a stock's price movement over a specified period, typically 5 days. By measuring how much a stock moves compared to its average volatility, the indicator helps traders identify when price actions become exceptionally volatile.
It specifically tracks whether a stock has moved more than 4 times its average true range within a 5-day window. This calculation provides a dynamic measure of price fluctuations that adapts to changing market conditions. Traders can use this information to assess potential trade entry and exit points
Why it may be useful
Understanding price volatility is crucial for making informed trading decisions. The ATR in Days signal provides traders with a quantitative method to assess market conditions and potential price movements. By tracking how much a stock deviates from its typical range, traders can identify periods of heightened market activity.
This information helps in managing risk, setting stop-loss levels, and determining position sizes. The indicator offers insights into market sentiment and potential trend reversals or continuations, making it a valuable tool for both day and swing traders
When to explore it
The ATR in Days signal works best during periods of significant market movement or when analyzing stocks with known volatility. Traders should use this indicator when looking to confirm trend strength, assess potential breakouts, or identify stocks experiencing unusual price action.
It is particularly useful during earnings seasons, major economic announcements, or in sectors prone to rapid price changes. The signal can help traders distinguish between normal price fluctuations and potentially significant market events. By providing a standardized measure of volatility, it allows for more objective trading decisions
Keep exploring
What we’ve verified
Access, alerts and repainting behaviour have not been independently verified for this indicator. Check the creator’s current publication and settings.
General descriptions and classifications are recovered research. Verified details above identify the specific checks we have completed. Check the creator’s current publication for later changes.