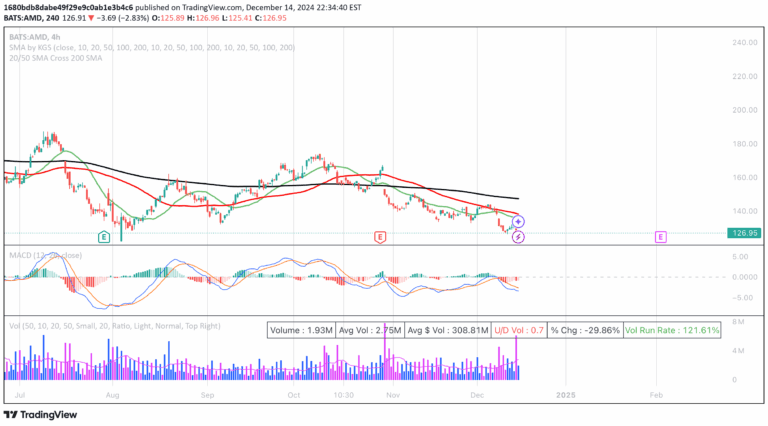
A chart-based signal that identifies significant trend changes by tracking the crossover of short and long-term moving averages, highlighting potential bullish and bearish market shifts.
Explore complementary indicator rolesHow it works
The Death Cross and Golden Cross signal uses two moving averages with different time periods to detect trend changes. By calculating a short-term (50-period) and long-term (200-period) simple moving average, the script tracks when these lines intersect on a price chart.
When the short-term moving average crosses above the long-term moving average, a Golden Cross is generated, signaling a potential bullish trend. Conversely, when the short-term moving average crosses below the long-term moving average, a Death Cross occurs, indicating a potential bearish trend. These crossovers are visually highlighted with colored labels and background changes.
Why it may be useful
Moving average crossovers provide traders with a systematic approach to identifying potential trend reversals in financial markets. By using objective, mathematically derived signals, traders can reduce emotional decision-making and rely on a more structured method of market analysis.
The Death Cross and Golden Cross are particularly valuable because they offer clear, visual confirmation of shifts in market momentum. These signals help traders recognize when a short-term trend might be gaining strength and potentially transitioning into a longer-term market movement, which can be crucial for making informed trading decisions.
When to explore it
The Death Cross and Golden Cross signals are most effective in markets with clear, trending characteristics, such as stocks, indices, and certain commodities. They work best in markets experiencing sustained directional movements rather than choppy, range-bound conditions where crossovers might generate false signals.
Traders should use these signals in conjunction with other technical and fundamental analysis tools to increase the probability of successful trades. They are particularly useful for longer-term traders like swing and position traders who are interested in capturing significant market trend changes, rather than short-term price fluctuations.
Keep exploring
What we’ve verified
Access, alerts and repainting behaviour have not been independently verified for this indicator. Check the creator’s current publication and settings.
General descriptions and classifications are recovered research. Verified details above identify the specific checks we have completed. Check the creator’s current publication for later changes.