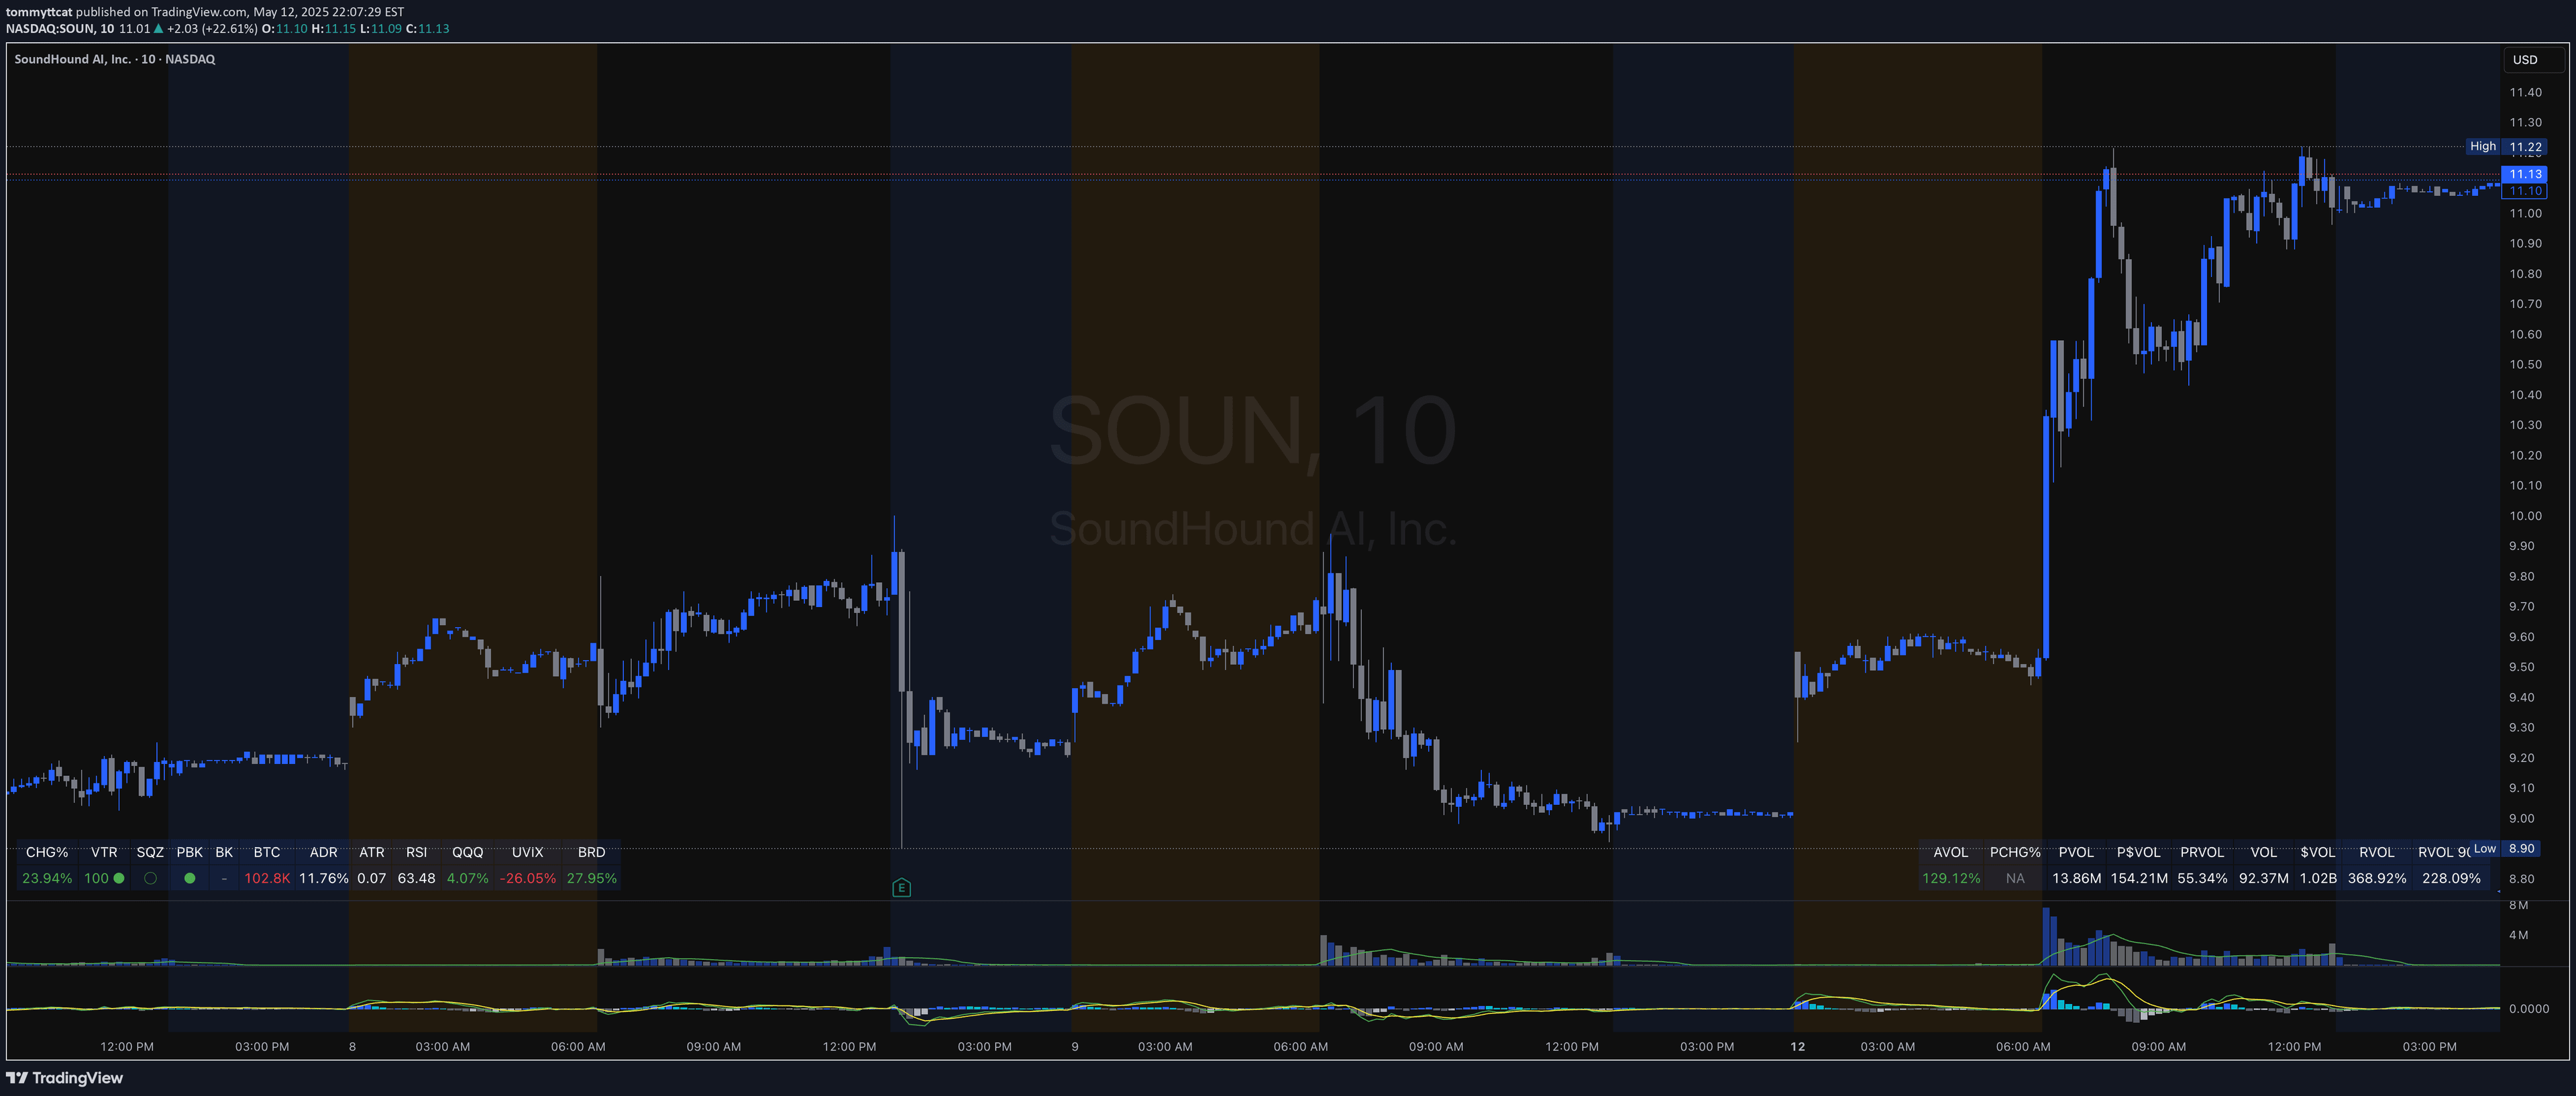
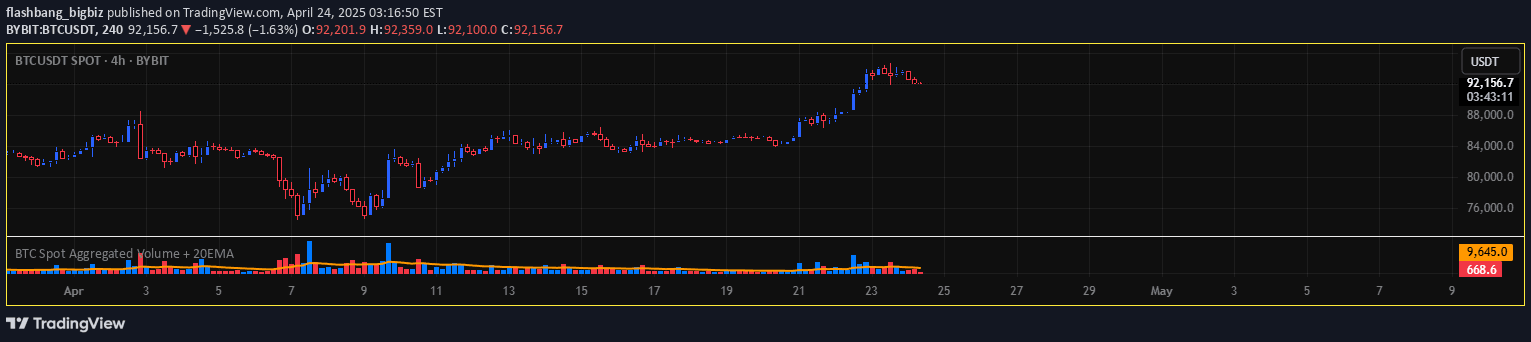
Delta bars analyze buying and selling volume to reveal market sentiment and potential price movement trends by comparing cumulative buy and sell volumes.
Explore complementary indicator rolesHow it works
Delta bars calculate the difference between buy and sell volumes, creating a dynamic representation of market sentiment through candlestick metrics. The indicator starts each candle with a delta of zero and tracks cumulative buy and sell volumes throughout the trading session.
The delta open remains zero, while the delta close represents the cumulative buy volumes minus sell volumes at the candle's endpoint. Delta max shows the highest volume delta during the session, and delta min reveals the lowest volume delta point.
Why it may be useful
Delta bars provide traders with a nuanced understanding of market dynamics by revealing underlying buying and selling pressures that might not be apparent from price action alone. This approach helps traders identify potential trend reversals and divergences between price movement and volume.
By tracking the relationship between price and volume delta, traders can gain insights into market sentiment, identifying potential weakness in current trends and anticipating possible trend changes before they become obvious through traditional price analysis.
When to explore it
Delta bars are most effective in volatile markets where volume analysis can provide critical insights into market sentiment and potential price movements. They work exceptionally well in liquid markets with clear volume data, such as major stock indices, popular stocks, and currency pairs.
Traders should use delta bars when seeking to confirm trend strength, identify potential reversals, and understand the underlying buying or selling pressure driving price action. They are particularly useful during periods of market uncertainty or when traditional price action signals appear ambiguous.
Keep exploring
What we’ve verified
Access, alerts and repainting behaviour have not been independently verified for this indicator. Check the creator’s current publication and settings.
General descriptions and classifications are recovered research. Verified details above identify the specific checks we have completed. Check the creator’s current publication for later changes.