
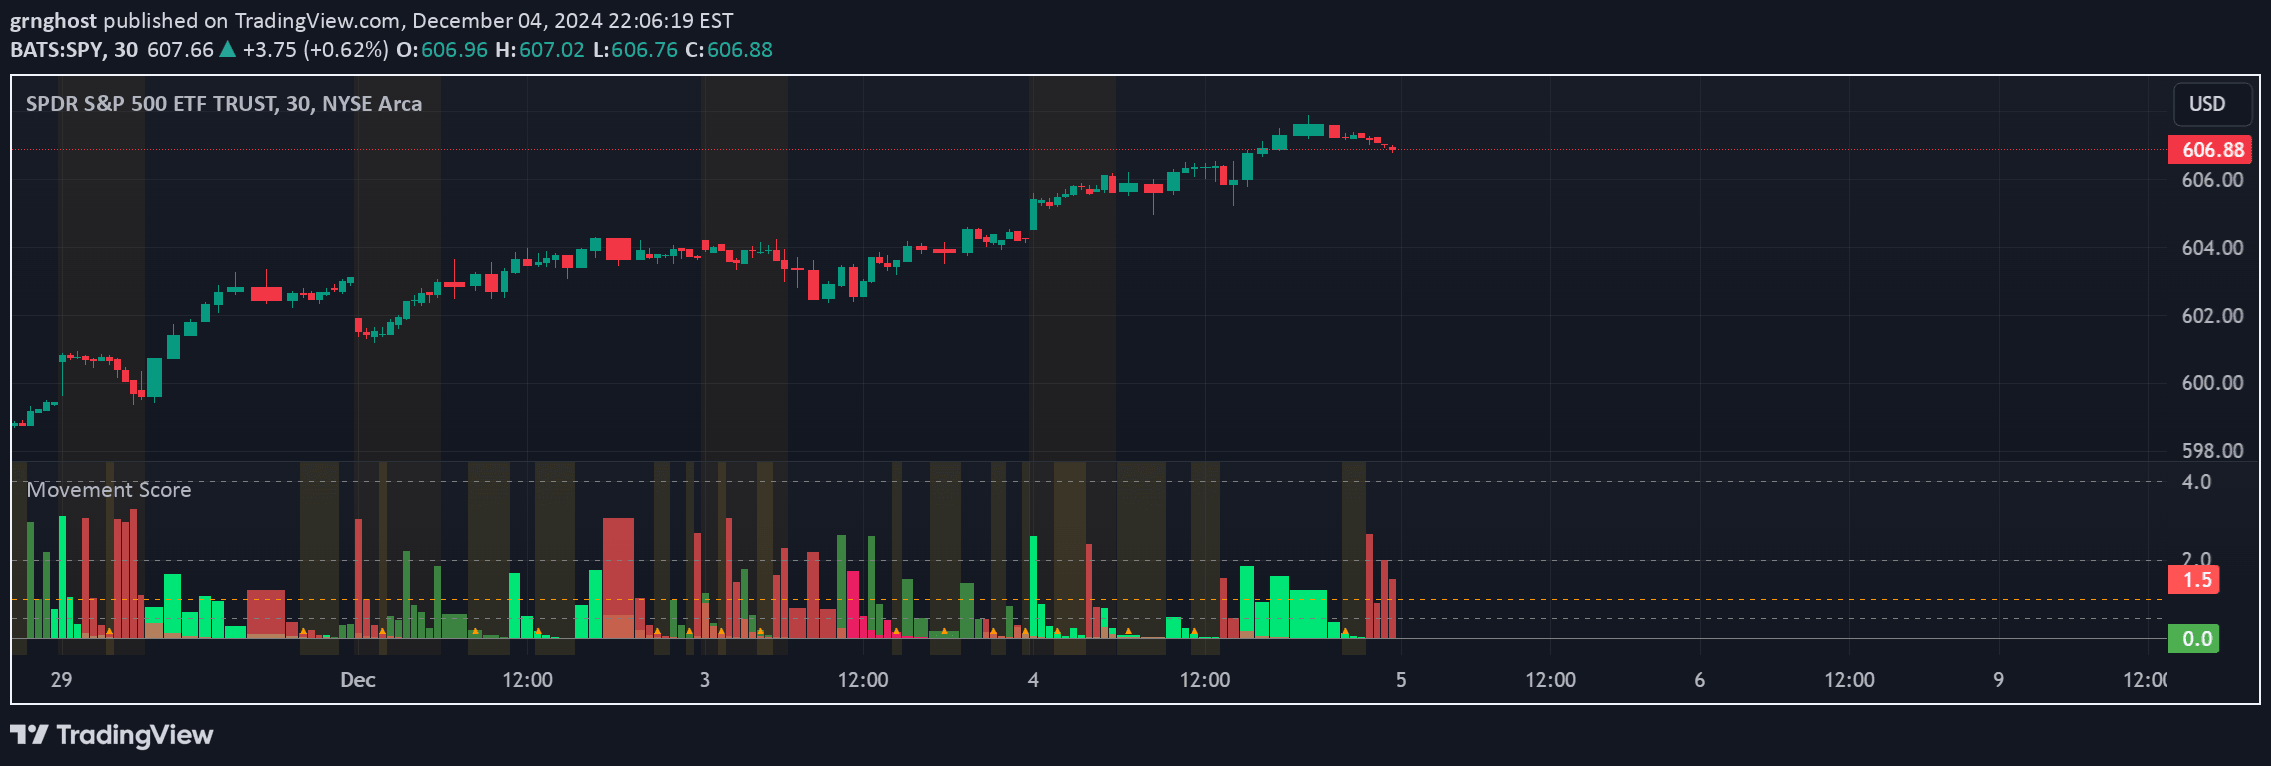
A trading indicator that measures price movement by comparing current price to previous bar's high/low, using normalized standard deviation to assess movement significance.
Explore complementary indicator rolesHow it works
The indicator calculates price movement by measuring the distance between current price and the previous bar's high or low on two different timeframes. It normalizes this movement using standard deviation, which helps traders understand the significance of price action.
By comparing price to previous bar extremes, the indicator generates color-coded visual signals. Green indicates upward movement, red shows downward movement, with color intensity reflecting whether the price is above higher timeframe highs or below higher timeframe lows.
Why it may be useful
This indicator provides traders with a quick and intuitive way to assess market movement and determine whether price action is statistically significant. By normalizing movement through standard deviation, traders can quickly identify meaningful price shifts and distinguish them from random market noise.
The visual color-coding and movement scoring offer traders an immediate understanding of market dynamics, helping them make more informed trading decisions and potentially identify entry and exit points more effectively.
When to explore it
The indicator is most effective in markets with clear directional movements and during periods of active trading. It works best for traders seeking to understand short-term price momentum and evaluate the strength of market moves across multiple timeframes.
Traders can utilize this tool in volatile markets where quick assessment of price movement is crucial, particularly in day trading and scalping scenarios where rapid decision-making is essential.
Keep exploring
What we’ve verified
Access, alerts and repainting behaviour have not been independently verified for this indicator. Check the creator’s current publication and settings.
General descriptions and classifications are recovered research. Verified details above identify the specific checks we have completed. Check the creator’s current publication for later changes.


