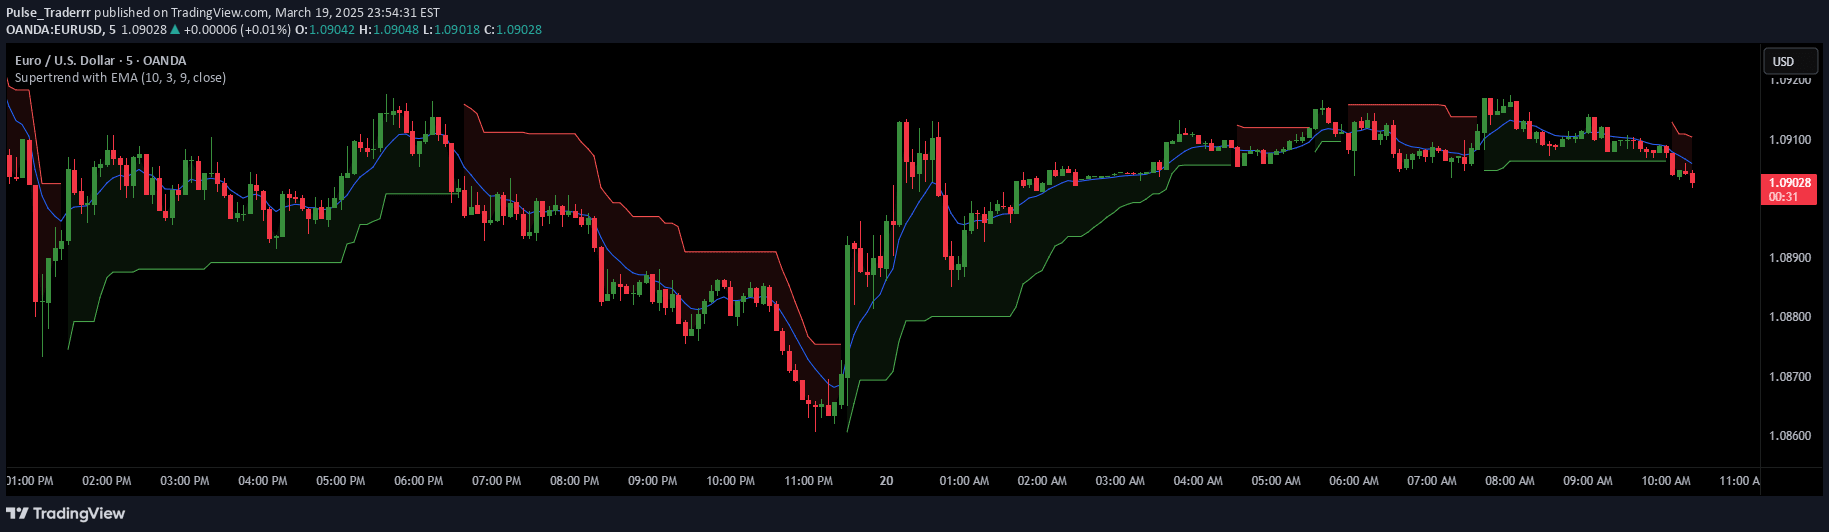
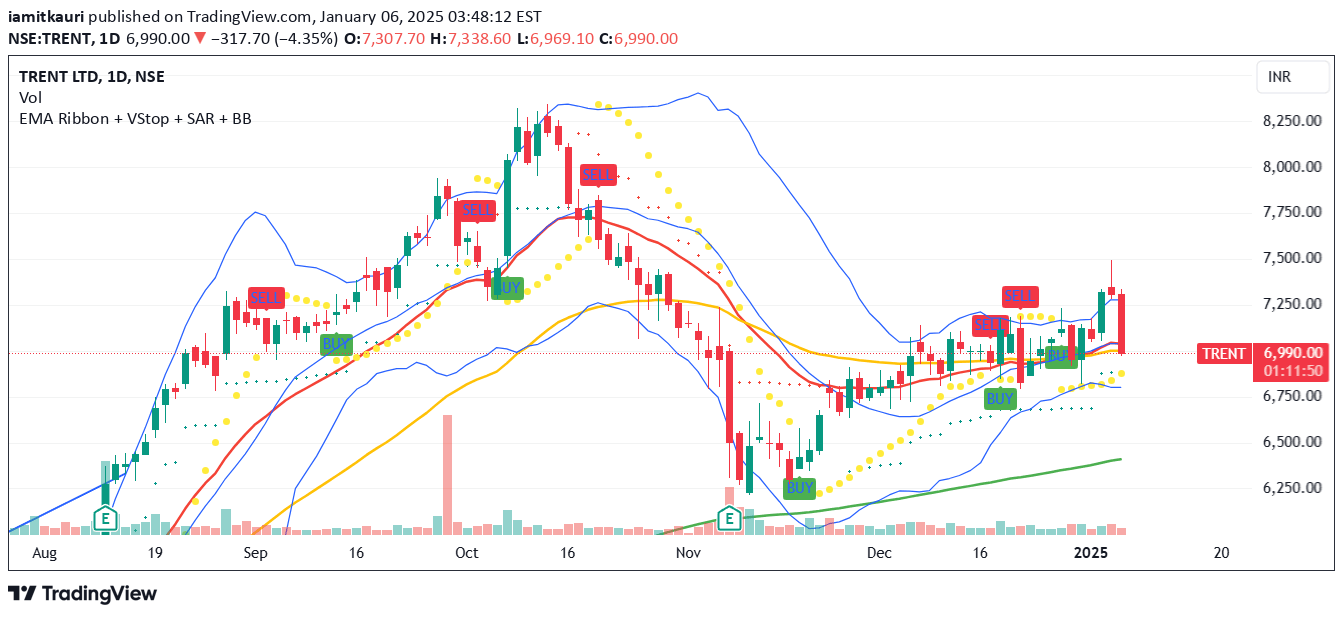
An advanced EMA tracking script that calculates percentage differences between 50, 100, and 150-period EMAs to identify market momentum and potential trend shifts.
Explore complementary indicator rolesHow it works
The script calculates Exponential Moving Averages (EMAs) for 50, 100, and 150 periods, focusing on the percentage differences between these moving averages. It computes the distance between EMA 50 and 100, and between EMA 100 and 150, providing a quantitative measure of market momentum.
By establishing a custom threshold percentage, typically set at 0.1%, the script identifies significant divergences between EMAs. When the percentage difference exceeds this threshold, visual markers are generated: green circles for bullish momentum and red circles for bearish momentum, with diamonds indicating the first occurrence of new signals.
Why it may be useful
This EMA tracking script offers traders a sophisticated method to understand market dynamics by revealing the nuanced relationships between different-period moving averages. By quantifying the percentage differences, traders can gain insights into potential trend shifts and momentum changes that might not be immediately apparent from price action alone.
The visual markers and dynamic plotting provide an intuitive way to quickly assess market conditions, helping traders make more informed decisions about entry and exit points. The script's ability to highlight divergences can serve as an early warning system for potential trend reversals or continuation.
When to explore it
The EMA percentage difference script is most effective in markets with clear trending characteristics, such as forex, stocks, and cryptocurrency markets. It works best during periods of sustained directional movement, where the interactions between different-period EMAs can provide meaningful insights into market momentum.
Traders should consider using this script in conjunction with other technical analysis tools to confirm signals and reduce false positives. It is particularly useful for identifying potential trend changes, assessing market strength, and developing more comprehensive trading strategies across various timeframes.
Keep exploring
What we’ve verified
Access, alerts and repainting behaviour have not been independently verified for this indicator. Check the creator’s current publication and settings.
General descriptions and classifications are recovered research. Verified details above identify the specific checks we have completed. Check the creator’s current publication for later changes.