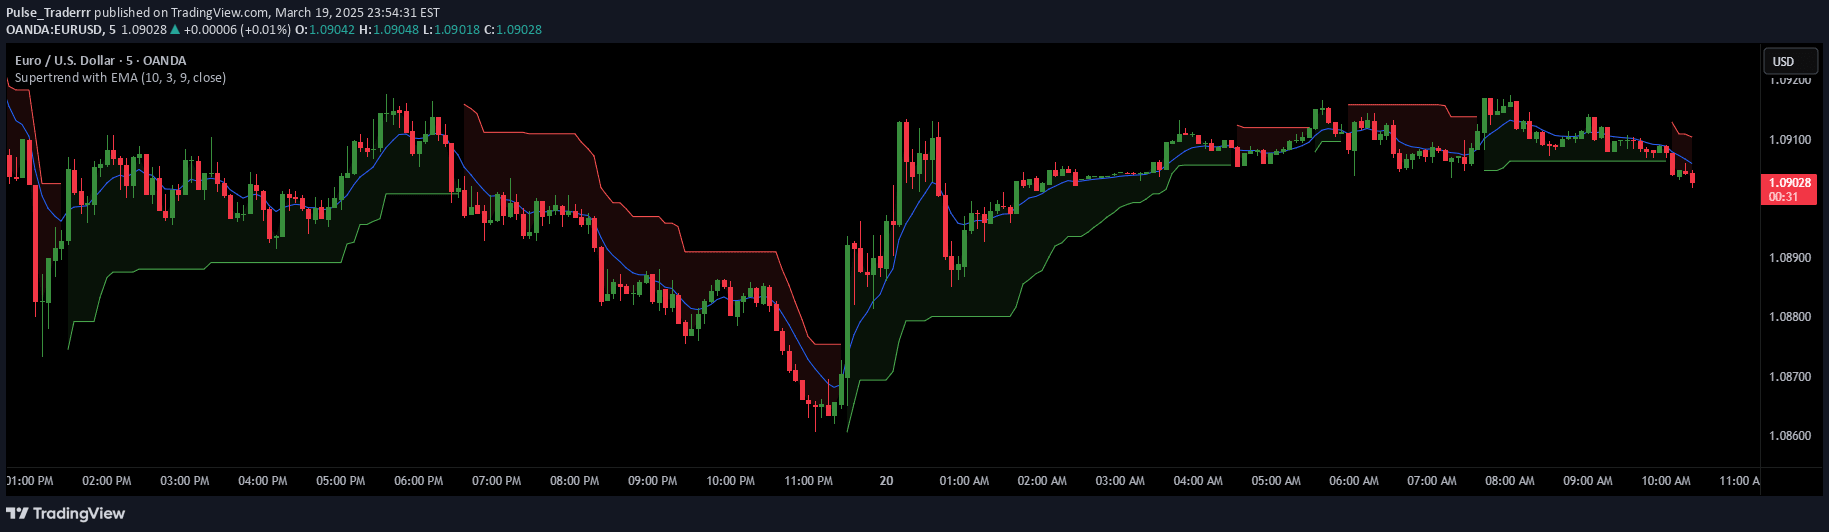
A multi-EMA indicator that visually tracks market trends and volatility using color-coded areas and adaptive markers to help traders quickly understand market conditions.
Explore complementary indicator rolesHow it works
The indicator calculates six exponential moving averages across different periods ranging from 15 to 300, creating a comprehensive view of price movements. These EMAs are color-coded with green and red shades to represent bullish and bearish trends, respectively, with gradient areas between each EMA showing market directionality.
Additionally, the indicator incorporates Average True Range (ATR) to measure market volatility, using a customizable threshold to detect high-volatility periods. When volatility exceeds this threshold, the chart displays a yellow background and red triangular markers, providing visual signals of increased market activity and potential trading opportunities.
Why it may be useful
This indicator helps traders quickly interpret complex market dynamics by transforming multiple technical inputs into an intuitive visual format. By combining trend analysis through EMAs and volatility detection via ATR, it provides a multi-dimensional view of market conditions that can enhance decision-making and strategic planning.
The color-coded and gradient EMA areas allow traders to rapidly assess market sentiment and trend strength, while the volatility markers offer immediate insights into potential high-impact trading zones. This comprehensive approach reduces the cognitive load of analyzing multiple indicators simultaneously.
When to explore it
The indicator is most effective in markets with clear trending characteristics, where price movements exhibit consistent directional momentum across multiple timeframes. It works exceptionally well in liquid markets like forex, major stock indices, and actively traded commodities where trend identification and volatility assessment are crucial.
Traders should leverage this tool during periods of potential trend initiation or reversal, particularly when combined with complementary momentum or oscillating indicators. It is especially valuable during market transitions, breakout scenarios, and when seeking to confirm trend strength and potential trading entry or exit points.
Keep exploring
What we’ve verified
Access, alerts and repainting behaviour have not been independently verified for this indicator. Check the creator’s current publication and settings.
General descriptions and classifications are recovered research. Verified details above identify the specific checks we have completed. Check the creator’s current publication for later changes.