Bitcoin Rainbow Wave
A comprehensive Bitcoin trading model that combines power law trend, rainbow chart, and halving cycle wave to provide insights into potential price movements and market cycles.
Explore 11,183 indicators. Filter beyond the obvious.
Discover the tools that fit the way you trade.
11,183 tools to explore
A comprehensive Bitcoin trading model that combines power law trend, rainbow chart, and halving cycle wave to provide insights into potential price movements and market cycles.
A Hurst-inspired pivot point indicator that marks cycle highs and lows using rainbow-colored lines and circles, helping traders forecast potential future market turning points.
A logarithmic regression curve for Bitcoin that color codes the price's deviation from its best-fit line, providing visual insight into trend dynamics and potential price extensions.
Bitcoin Wave Rainbow model provides a powerful trend visualization tool that maps Bitcoin's price trajectory using logarithmic trend lines and color-coded zones for strategic market insights.
Rainbow Drift Beta is an EMA-based indicator that detects trend direction and potential entry points by analyzing multiple exponential moving averages across different timeframes.
A technical analysis indicator that combines market slope and RSI to detect potential price reversals by analyzing the slope's momentum and identifying early trend change signals.
An advanced trading indicator using multiple Simple Moving Averages weighted by Fibonacci principles to identify market trends, support/resistance levels, and potential trading opportunities across various timeframes.
A multi-layered rainbow moving average indicator designed to detect market trends using 10 color-coded moving averages and four distinct trend detection methods.
A Fibonacci-based adaptive moving average that creates dynamic support and resistance bands using high and low price levels to identify trend strength and potential price zones.
A multi-dimensional trend analysis indicator using rainbow-colored moving averages to visualize market momentum across different timeframes and identify complex trend alignments.
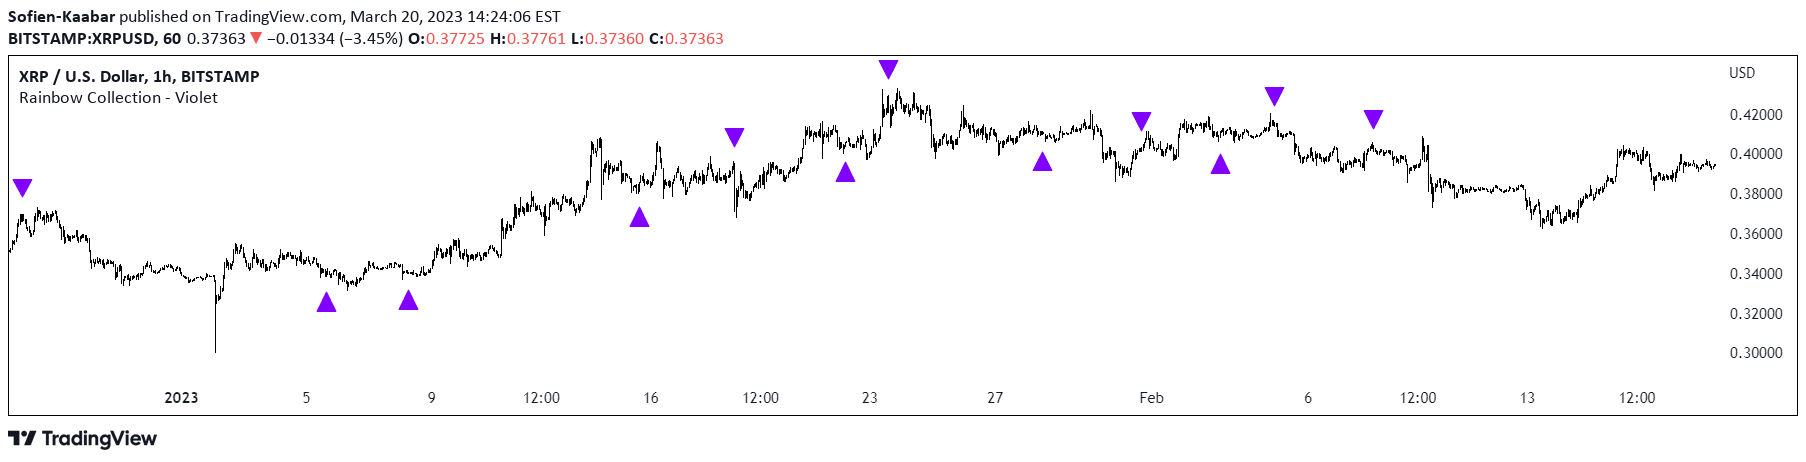
The Violet indicator uses a 20-period Hull moving average to identify potential market trend reversals by analyzing multiple historical price periods relative to their moving averages.
The HMA Fibonacci Rainbow Waves indicator combines Hull Moving Average with Fibonacci weighting to provide smoothed trend analysis across multiple timeframes, revealing market dynamics with enhanced clarity.
Likes, views, and comments are historical TradingView snapshots. They describe attention, not trading performance.