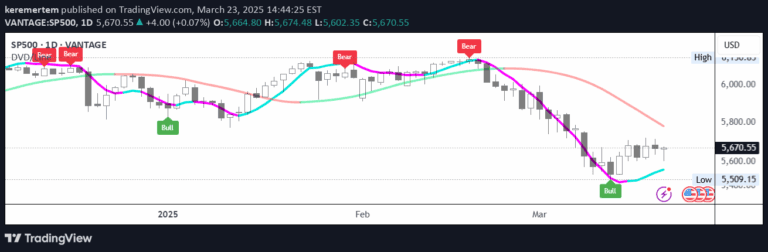
Distance From Moving Average helps traders visualize price deviation from a selected moving average, offering insights into market momentum and trend direction.
Explore complementary indicator rolesHow it works
The indicator calculates the distance between the current price and a selected moving average type, such as Simple, Exponential, Weighted, or Hull Moving Average. Users can customize the moving average length, typically defaulting to 200 periods, which allows for flexible analysis across different trading strategies.
By computing the mathematical difference between current price and the chosen moving average, the indicator generates a visual representation that shows whether prices are above or below the average. The resulting plot is color-coded to provide immediate visual feedback, with lime indicating prices above the moving average and red signaling prices below.
Why it may be useful
The Distance From Moving Average indicator provides traders with a quick and intuitive method to understand market momentum and potential trend changes. By showing the relationship between current price and a key moving average, traders can quickly assess whether an asset is trending bullishly or bearishly, which can inform critical entry and exit decisions.
This tool is particularly valuable because it simplifies complex price movement analysis into an easily digestible visual format. Traders can rapidly interpret market conditions without extensive calculations, making it useful for both novice and experienced market participants seeking to understand short-term and long-term price trends.
When to explore it
The indicator is most effective in trending markets where prices are consistently moving in a specific direction, either upward or downward. Traders can use this tool across various timeframes, from short-term scalping to longer-term swing trading, making it a versatile analysis instrument for different trading styles and market conditions.
Optimal usage occurs when combining this indicator with other technical analysis tools to confirm signals and reduce false positives. Traders should pay special attention to color changes and significant distance measurements, which can indicate potential trend reversals or momentum shifts in the market.
Keep exploring
What we’ve verified
Access, alerts and repainting behaviour have not been independently verified for this indicator. Check the creator’s current publication and settings.
General descriptions and classifications are recovered research. Verified details above identify the specific checks we have completed. Check the creator’s current publication for later changes.