
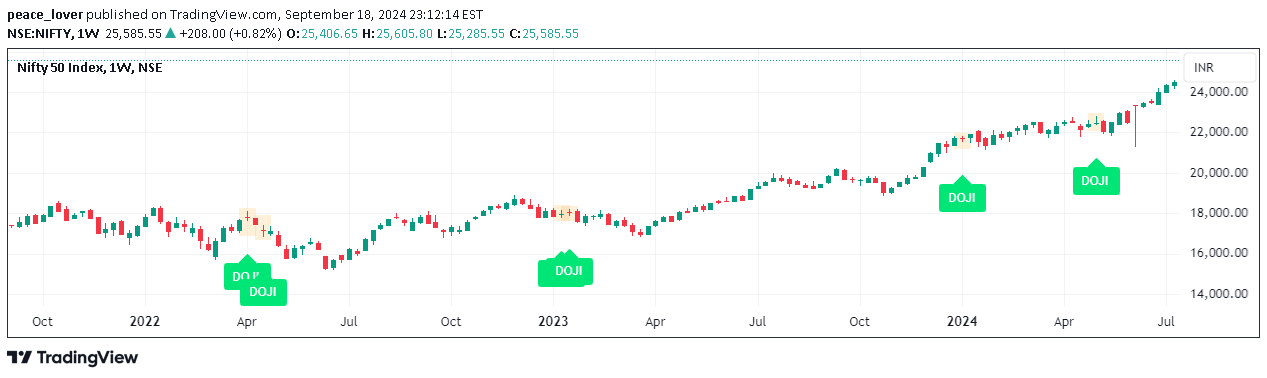
A Doji pattern detection method using precise criteria involving percentage differences between price ranges and wick sizes to identify potential market reversal or indecision signals.
Explore complementary indicator rolesHow it works
The Doji pattern detection works by analyzing three critical conditions in candlestick formation. First, it calculates the percentage difference between the open and close prices relative to the high and low price range. Second, it measures the upper and lower wick sizes against predetermined minimum thresholds specific to the selected chart timeframe.
The third condition involves comparing the sizes of the upper and lower wicks to ensure they meet a minimum threshold difference. By systematically evaluating these geometric and proportional characteristics, the algorithm identifies potential Doji patterns that signify market indecision or potential trend reversals.
Why it may be useful
Doji patterns provide crucial insights into market sentiment and potential trend changes by revealing moments of equilibrium between buyers and sellers. They help traders recognize periods of market uncertainty where neither bulls nor bears have decisive control, which can signal potential trend reversals or consolidation phases.
By quantifying the pattern's characteristics through precise measurements, this method offers a more systematic approach to identifying Doji formations compared to traditional visual recognition. This algorithmic detection increases the reliability of pattern identification and helps traders make more informed decisions about potential market direction.
When to explore it
The Doji pattern detection method is most effective in volatile market conditions where price movements are more dynamic and unpredictable. It works best in timeframes that allow for more granular price analysis, such as intraday and short-term charts where quick market sentiment shifts are more pronounced.
Traders should apply this signal during periods of potential market transitions, such as around major economic announcements, earnings reports, or when prices are approaching significant support and resistance levels. It is particularly useful for scalpers and day traders who require rapid, precise market sentiment assessment.
Keep exploring
What we’ve verified
Access, alerts and repainting behaviour have not been independently verified for this indicator. Check the creator’s current publication and settings.
General descriptions and classifications are recovered research. Verified details above identify the specific checks we have completed. Check the creator’s current publication for later changes.


