A range-spotting indicator that analyzes candle data, tracking DrawBack and DrawDown values to provide insights into market movements and potential trading opportunities.
Explore complementary indicator rolesHow it works
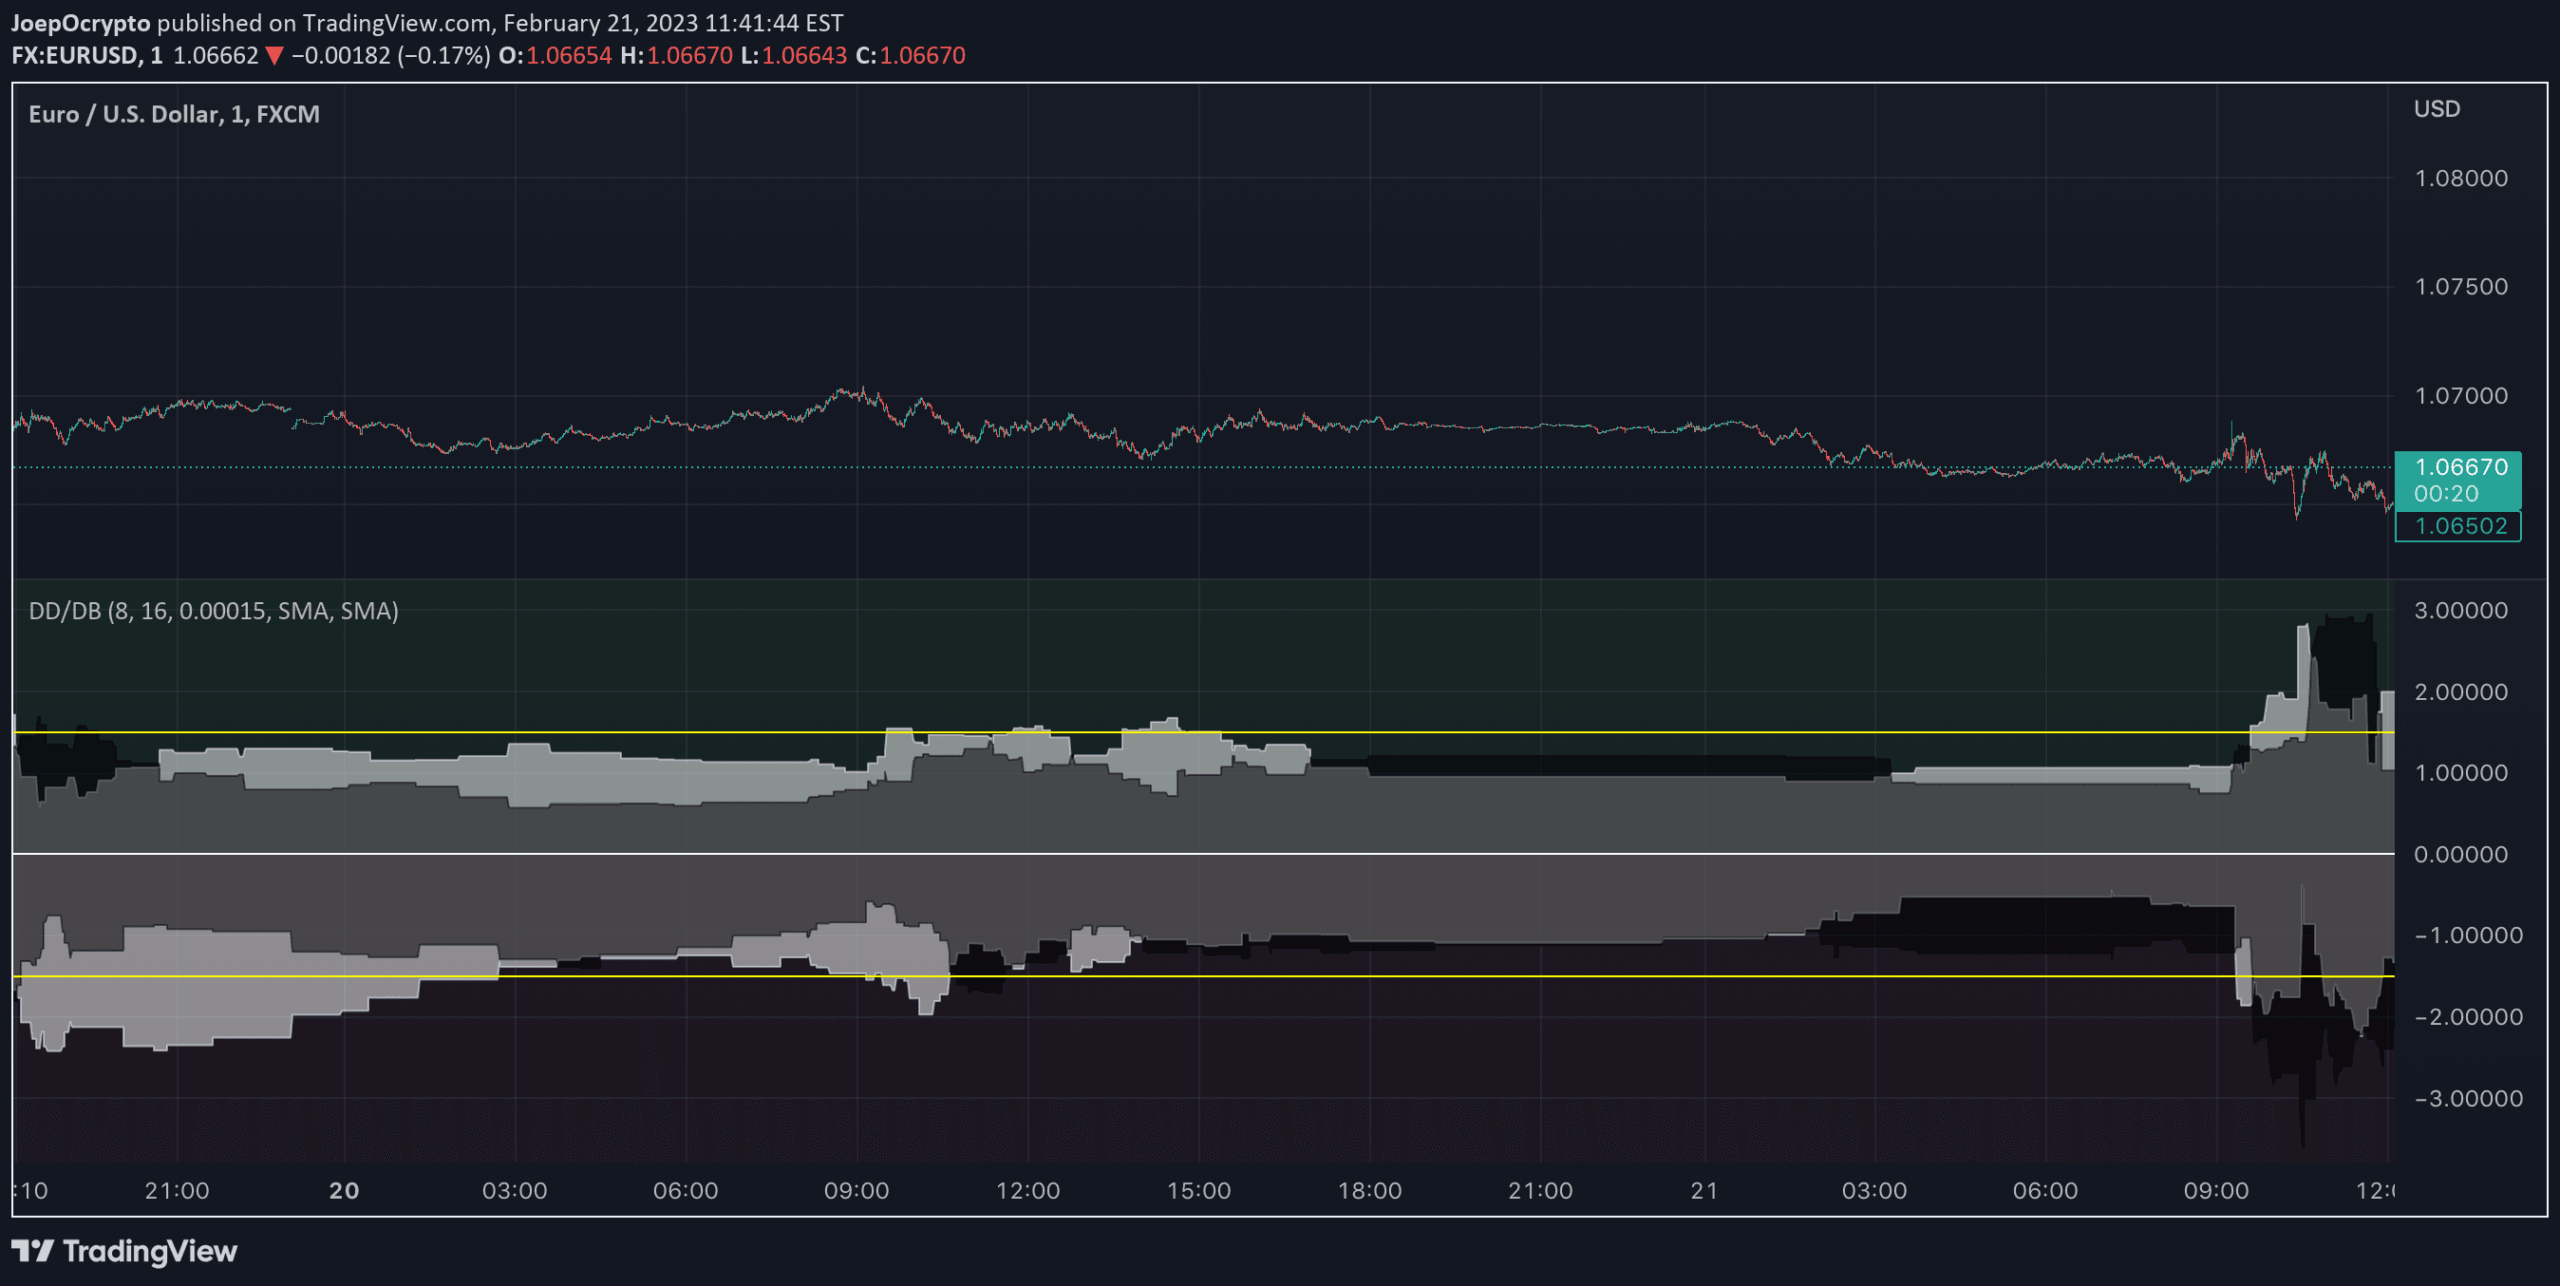
The indicator operates by analyzing green and red candles, plotting data above and below the zero line to represent different market conditions. It calculates DrawBack and DrawDown values over a specified length, using an adjustable EMA length and Real Body size to filter and refine the analysis.
When the white area exceeds the black area, it indicates that the DrawBack is higher than the DrawDown. The indicator works counterintuitively, requiring bullish candles to move down and bearish candles to move up to register meaningful values.
Why it may be useful
This indicator provides traders with a unique perspective on market dynamics by revealing hidden price movements and potential trend reversals. By tracking DrawBack and DrawDown values, traders can gain insights into market sentiment and potential entry or exit points that might not be immediately apparent.
The flexibility of adjusting parameters like EMA length and Real Body size allows traders to customize the indicator to different market conditions and trading styles, making it a versatile tool for technical analysis.
When to explore it
The indicator is most effective in markets with clear directional movements and when traders want to identify potential reversals or trend continuation signals. It works best on timeframes where the Real Body size is significant enough to provide meaningful data, typically avoiding extremely low-point candles.
Traders should consider using this indicator in conjunction with other technical analysis tools to confirm signals and reduce false positives. It is particularly useful for short-term trading strategies that require quick decision-making and precise market entry points.
Keep exploring
What we’ve verified
Access, alerts and repainting behaviour have not been independently verified for this indicator. Check the creator’s current publication and settings.
General descriptions and classifications are recovered research. Verified details above identify the specific checks we have completed. Check the creator’s current publication for later changes.