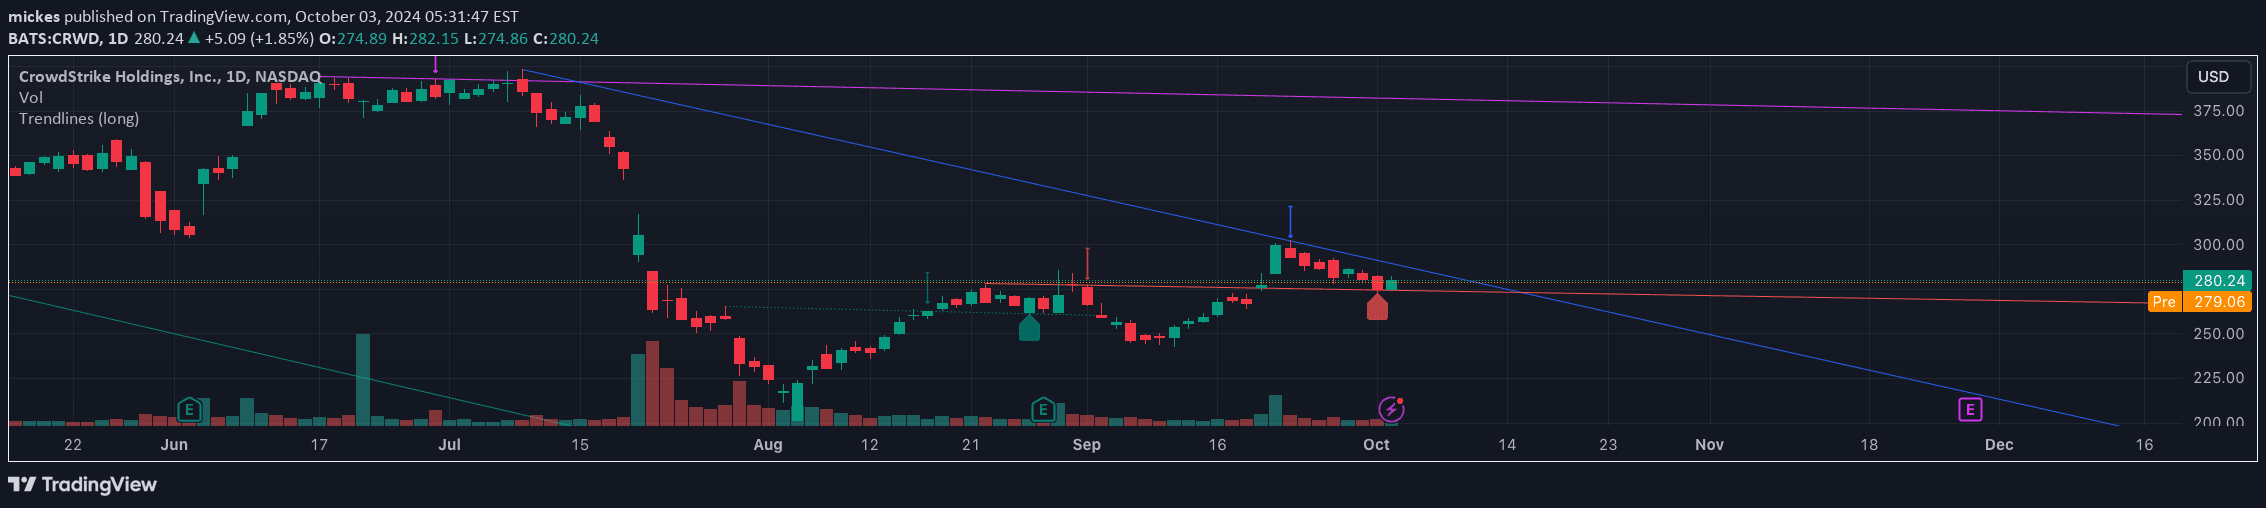
A trading strategy using Dow Theory principles to analyze market trends by identifying breakout signals for stock price movements in MSB.
Explore complementary indicator rolesHow it works
The Dow Theory-based trading signal focuses on color-coded breakout indicators for the MSB stock. When the indicator turns red, it signifies a potential downward trend break, suggesting a selling opportunity. Conversely, when the indicator turns green, it indicates a potential upward trend break, recommending a buying strategy.
The signal operates by monitoring price movements and comparing them against established trend lines and historical market behavior. By using color-coded signals, traders can quickly interpret market dynamics and make rapid trading decisions based on these visual breakout indicators.
Why it may be useful
This trading signal provides traders with a simplified method to interpret complex market trends using Dow Theory principles. By translating technical analysis into an easy-to-understand color-coded system, it reduces the complexity of decision-making and helps traders identify potential entry and exit points more efficiently.
The signal's strength lies in its ability to quickly communicate market sentiment and trend changes. Traders can leverage these color-coded indicators to make more informed decisions, potentially reducing emotional trading and improving overall strategic approach to market movements.
When to explore it
The Dow Theory-based signal works best in markets with clear trending characteristics and moderate volatility. It is particularly effective for traders who prefer visual and straightforward trend interpretation methods. The signal can be most beneficial during periods of consistent market momentum, where price trends are more predictable.
Traders should apply this signal in conjunction with other technical analysis tools to confirm signals and reduce false positives. It is most suitable for day trading and swing trading strategies, where identifying trend shifts quickly can lead to more profitable trading decisions.
Keep exploring
What we’ve verified
Access, alerts and repainting behaviour have not been independently verified for this indicator. Check the creator’s current publication and settings.
General descriptions and classifications are recovered research. Verified details above identify the specific checks we have completed. Check the creator’s current publication for later changes.