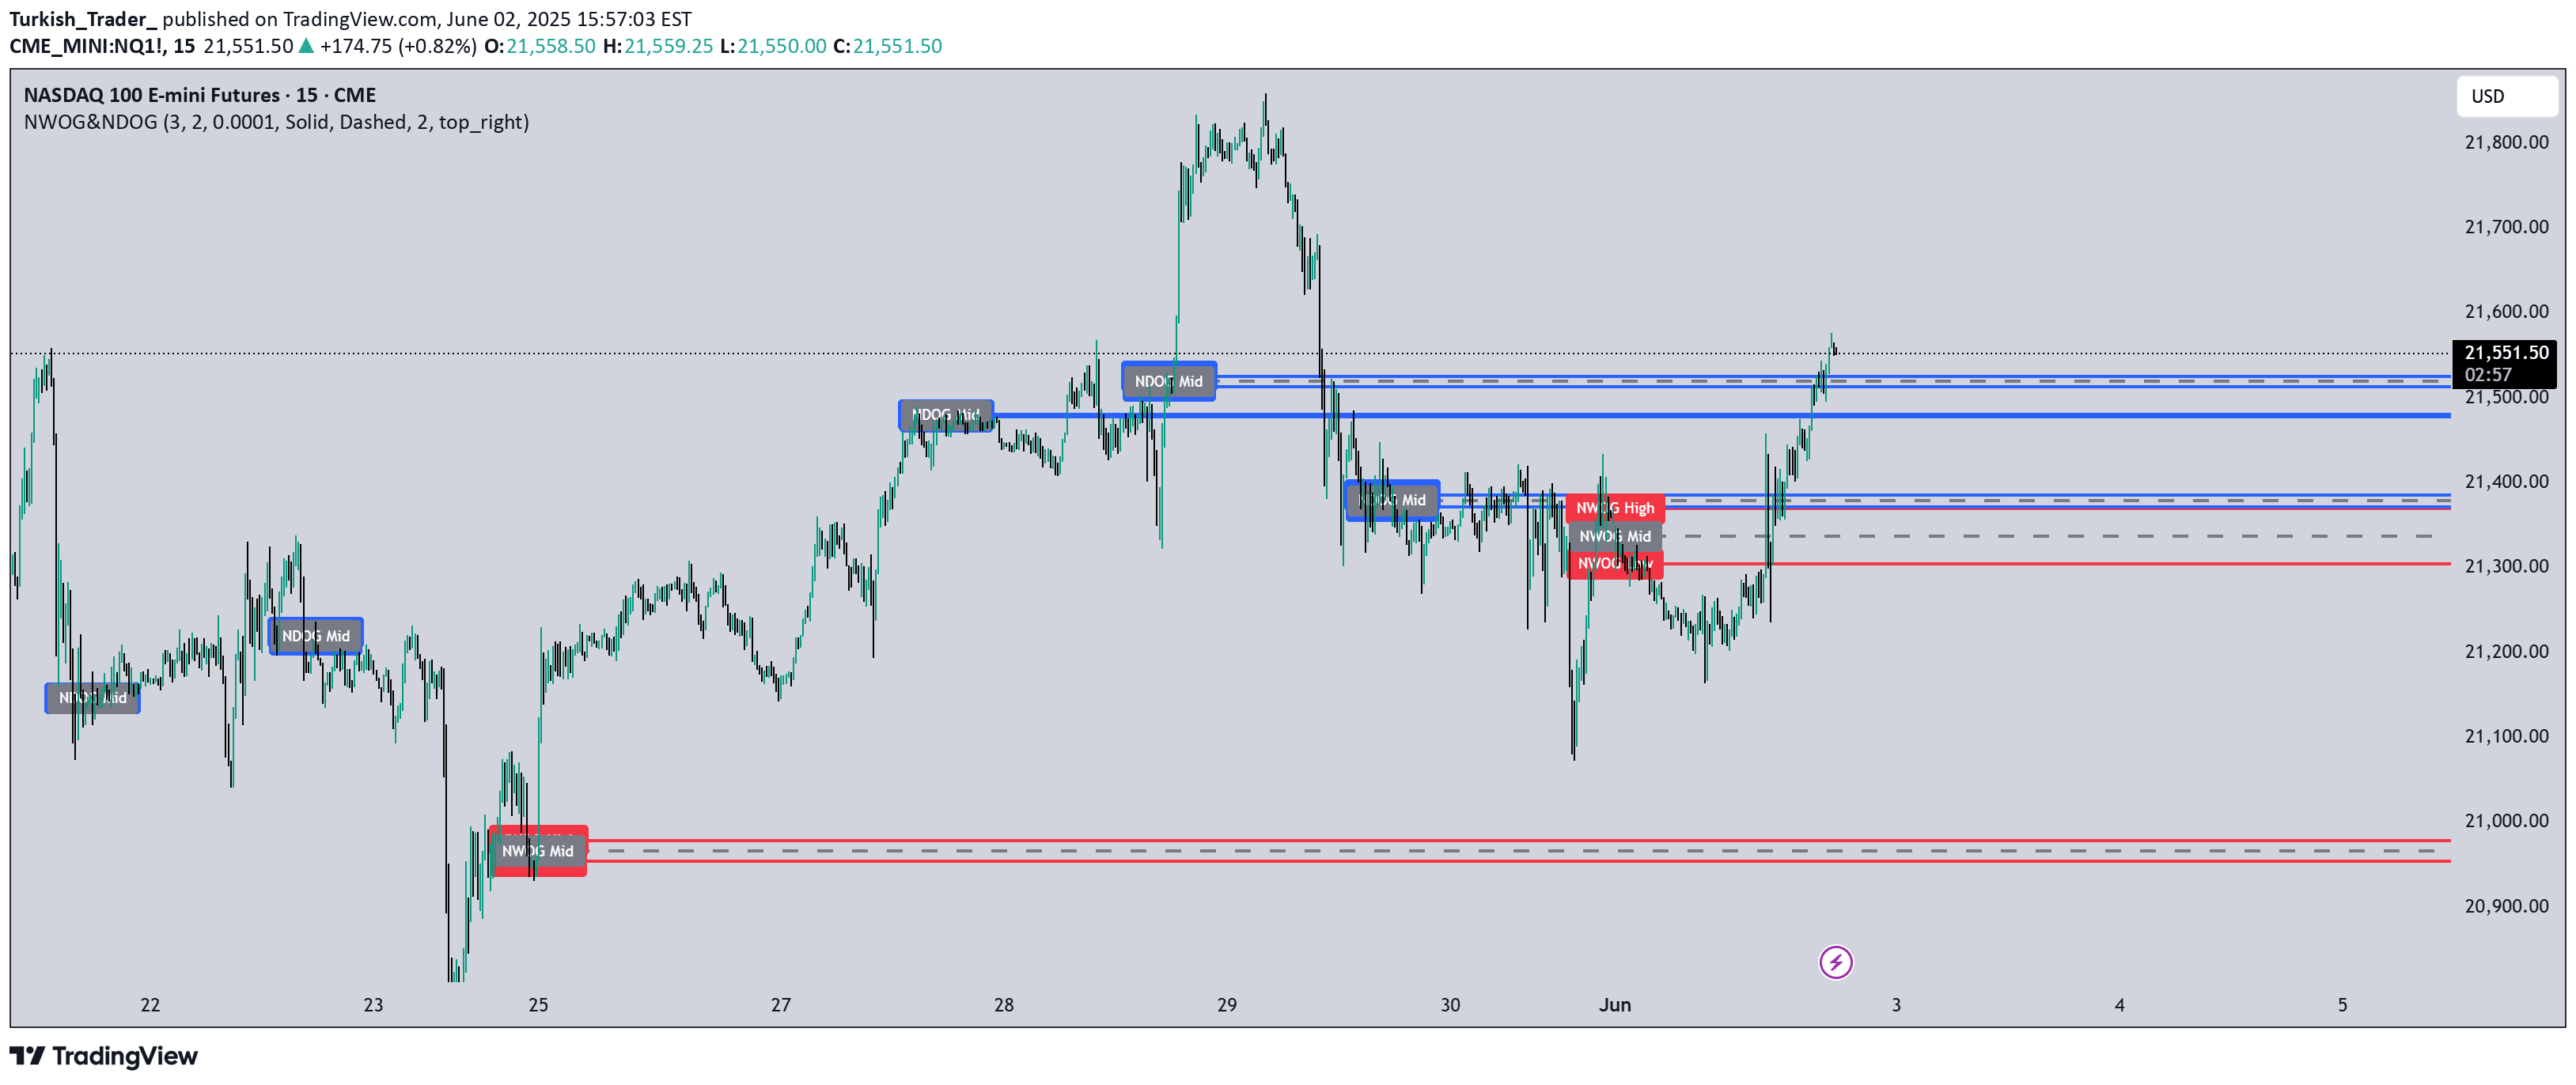
A dynamic indicator that calculates the 50% midpoint of a selected price range, helping traders identify key market equilibrium zones and potential price reaction points.
Explore complementary indicator rolesHow it works
The 50% Range Level Indicator works by allowing traders to select a specific price range on their chart and automatically calculating its midpoint. Once the range is defined, the indicator draws a horizontal line precisely at the 50% level, providing a clear visual reference point for potential price interactions.
Traders can manually select the range by choosing a starting and ending price point, which could be based on recent swing highs and lows, historical support and resistance levels, or any significant price movement. The indicator then dynamically displays the middle point, helping traders quickly identify where price might potentially consolidate, reverse, or gather momentum.
Why it may be useful
The 50% Range Level Indicator is crucial because it highlights a key psychological and technical price zone where market participants often exhibit predictable behavior. By identifying the midpoint of a range, traders can gain insights into potential support and resistance levels, helping them make more informed trading decisions.
This indicator provides a simple yet powerful tool for understanding market dynamics, offering a clear visual representation of price equilibrium. It helps traders recognize potential turning points, confirm trend reversals, and develop more strategic entry and exit points based on a scientifically derived market midpoint.
When to explore it
The 50% Range Level Indicator is most effective in markets that demonstrate clear range-bound or consolidating behavior, such as during periods of sideways price action or when prices are trading within a defined channel. Traders can use this tool across various timeframes and asset classes, making it versatile for different trading styles and market conditions.
It is particularly useful when combined with other technical analysis tools, such as trend indicators, volume analysis, or momentum oscillators. By providing an additional layer of analysis, the 50% Range Level Indicator can help traders confirm potential trade setups, identify potential reversal zones, and enhance overall market interpretation.
Keep exploring
What we’ve verified
Access, alerts and repainting behaviour have not been independently verified for this indicator. Check the creator’s current publication and settings.
General descriptions and classifications are recovered research. Verified details above identify the specific checks we have completed. Check the creator’s current publication for later changes.