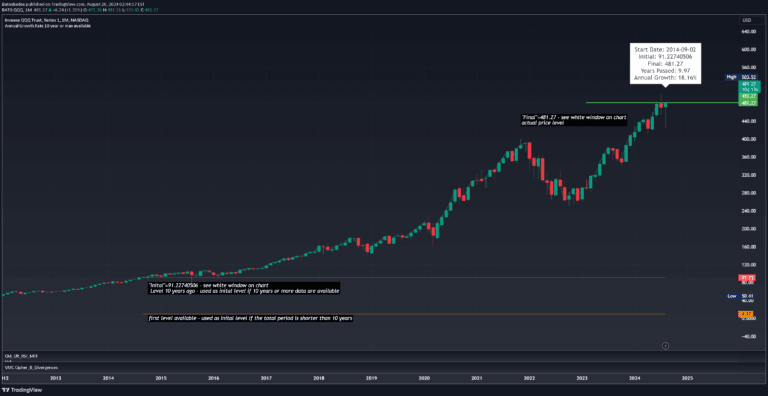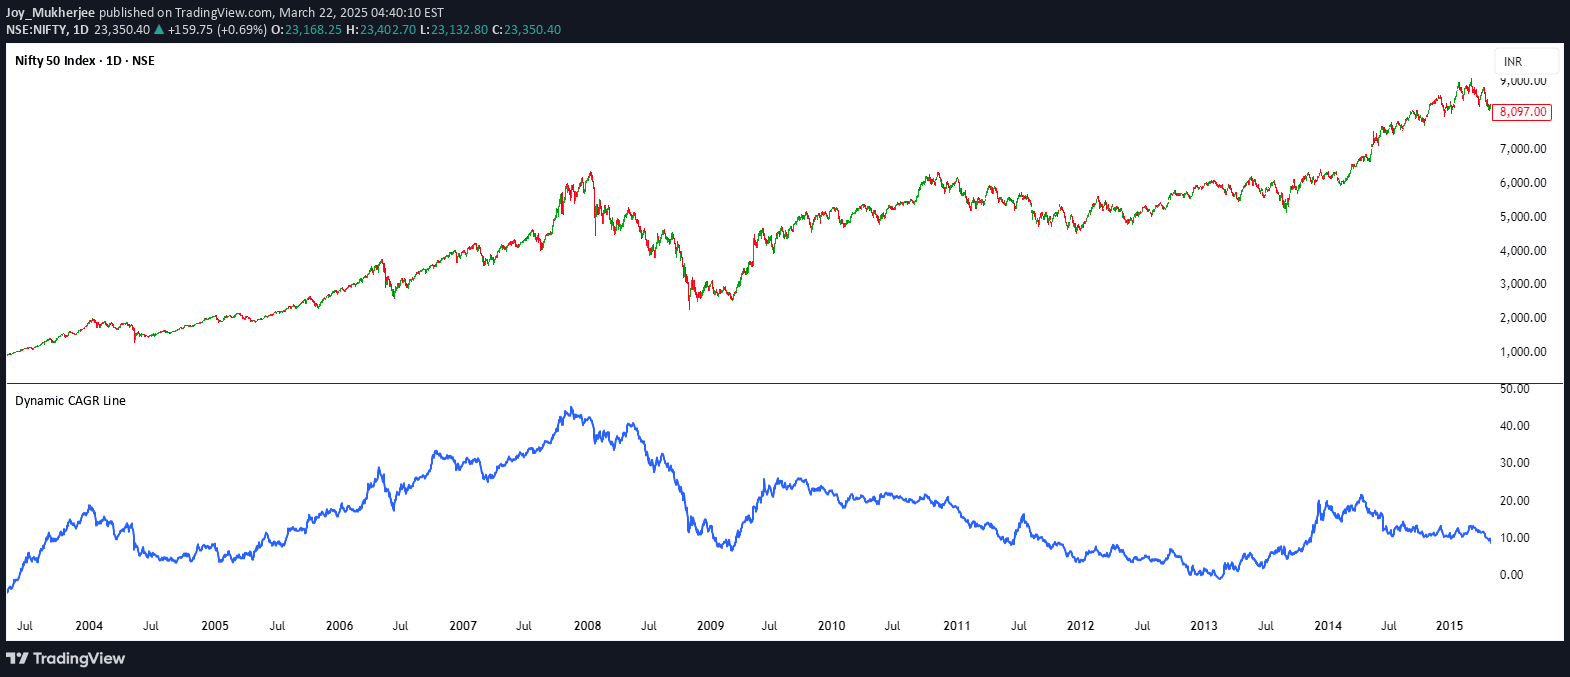
A dynamic indicator that calculates and displays the Compound Annual Growth Rate (CAGR) over a specified historical period, helping traders analyze long-term performance trends in a separate chart pane.
Explore complementary indicator rolesHow it works
The Dynamic CAGR Line indicator calculates the Compound Annual Growth Rate by comparing the current closing price to a historical closing price from a user-defined lookback period. It converts the lookback years into trading bars, typically using 252 bars per year for daily charts.
The total return is computed by comparing start and end prices, then annualized using a mathematical formula. The indicator converts the result to a percentage and plots it as a blue line in a separate chart pane, providing a clear visualization of the asset's growth rate over time
Why it may be useful
This indicator offers traders a comprehensive view of an asset's long-term performance by providing an annualized growth rate that smooths out short-term fluctuations. It helps investors quickly assess the sustained performance of a financial instrument over multiple years.
The dynamic nature of the CAGR line allows for real-time tracking of growth trends. By displaying the percentage in a separate pane, it provides a clean, uncluttered view of performance without interfering with the main price chart
When to explore it
The Dynamic CAGR Line is most effective for investors and traders focused on long-term performance analysis. It works best with daily charts and sufficient historical data covering the selected lookback period.
Traders can use it to evaluate investment performance across different timeframes by adjusting the lookback years. It's particularly useful for comparing the growth rates of different assets, identifying consistent performers, and making informed decisions about long-term investment strategies
Keep exploring
What we’ve verified
Access, alerts and repainting behaviour have not been independently verified for this indicator. Check the creator’s current publication and settings.
General descriptions and classifications are recovered research. Verified details above identify the specific checks we have completed. Check the creator’s current publication for later changes.