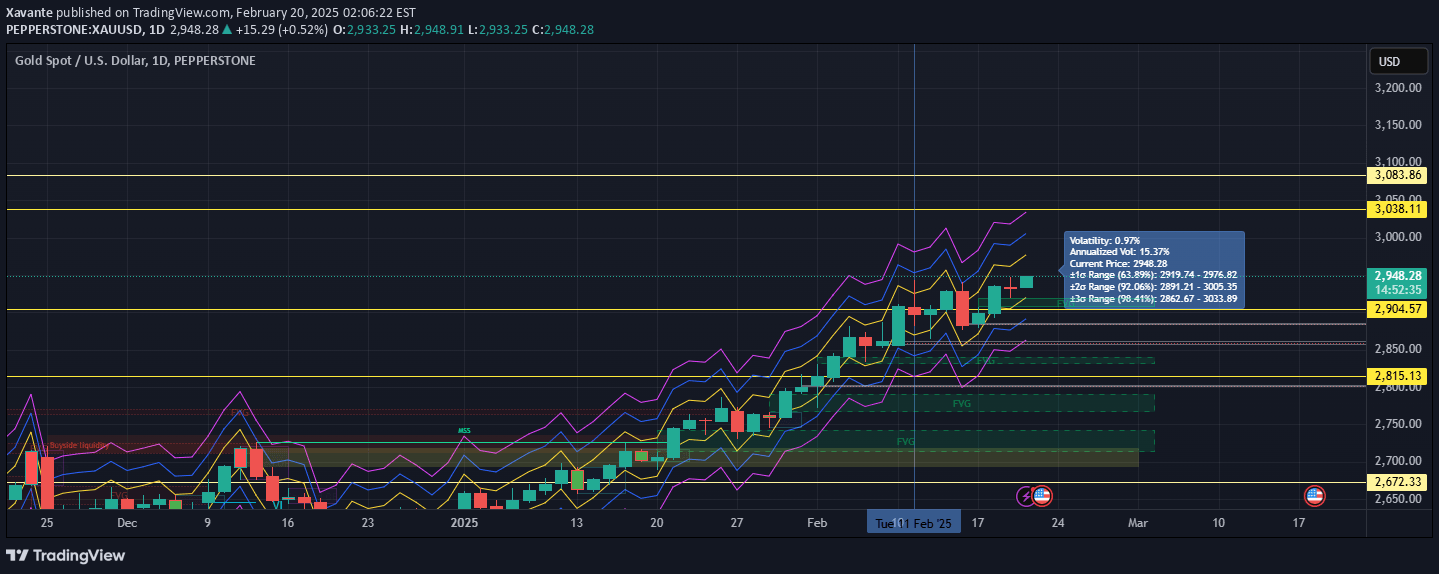
A dynamic moving average indicator that automatically identifies the most influential MA lengths, helping traders determine significant market support and resistance levels with greater precision.
Explore complementary indicator rolesHow it works
The Dynamic MA Confluence Indicator analyzes multiple moving average lengths simultaneously, ranging from short-term to long-term periods. By setting a customizable proximity percentage, the indicator determines which moving averages are closest to each other, effectively identifying the most significant confluence points on the chart.
Once the closest moving averages are identified, the indicator calculates their average to establish a dynamic support or resistance level. Traders can choose between Simple Moving Averages (SMA) and Exponential Moving Averages (EMA), allowing flexibility in adapting the indicator to different trading strategies and market conditions.
Why it may be useful
The Dynamic MA Confluence Indicator simplifies technical analysis by automatically optimizing moving average selection, reducing the guesswork in identifying critical market levels. By highlighting the most influential moving average lengths, traders can gain a clearer understanding of potential trend directions and market dynamics without manually testing multiple moving average combinations.
This indicator provides traders with a powerful tool to enhance decision-making, offering actionable insights into market trends and potential support or resistance zones. Its adaptability and customizable sensitivity make it valuable for traders across different experience levels and trading styles, helping them make more informed and confident trading decisions.
When to explore it
The Dynamic MA Confluence Indicator is most effective in markets with clear trending characteristics, where moving averages can provide meaningful insights into price momentum and potential trend reversals. It works particularly well in liquid markets with sufficient price movement, such as major currency pairs, stock indices, and actively traded commodities.
Traders should consider using this indicator during periods of stable market conditions and when seeking to confirm trend strength or potential trend changes. It is especially useful when combined with other technical analysis tools, helping to validate signals and provide a more comprehensive view of market dynamics.
Keep exploring
What we’ve verified
Access, alerts and repainting behaviour have not been independently verified for this indicator. Check the creator’s current publication and settings.
General descriptions and classifications are recovered research. Verified details above identify the specific checks we have completed. Check the creator’s current publication for later changes.