
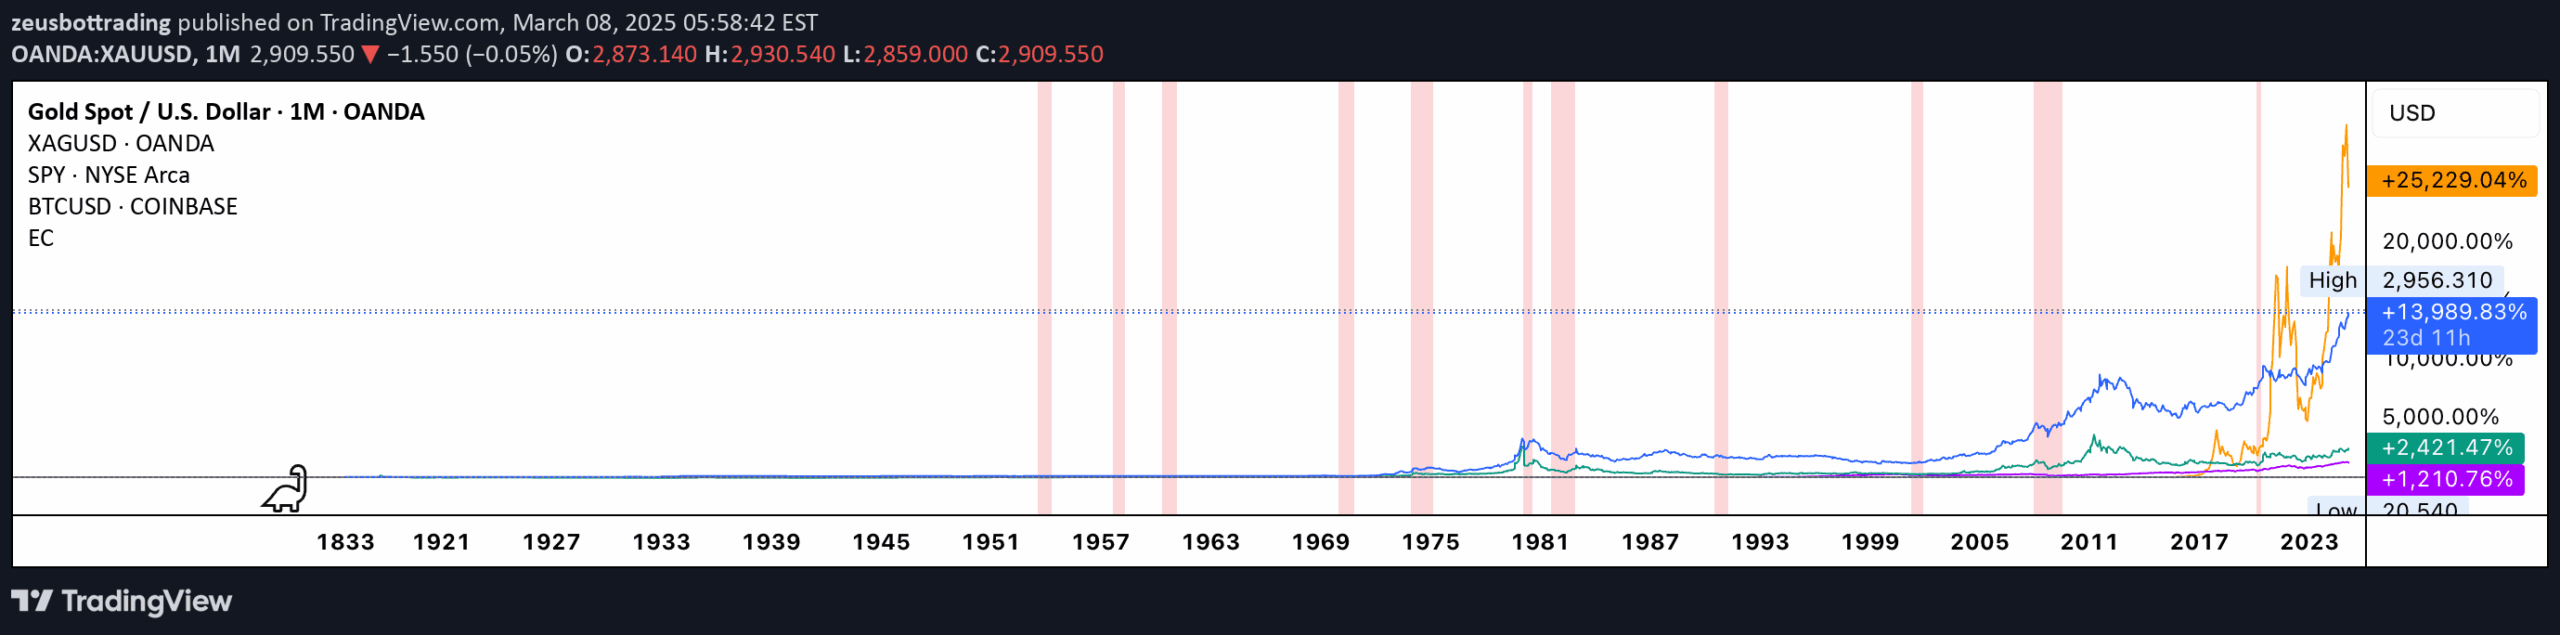
Economic Crises Indicator visually highlights major global market recessions from 1953-2020, providing historical context for financial analysis and performance assessment.
Explore complementary indicator rolesHow it works
The Economic Crises Indicator marks significant economic downturns by shading specific historical periods in red with 80% transparency. It automatically highlights predefined crisis periods ranging from the Korean War Recession in 1953 to the COVID-19 Recession in 2020.
By overlaying these crisis zones on financial charts, traders can visually track how different assets performed during these turbulent economic times. The indicator allows for comparative analysis across multiple financial instruments like Gold, Silver, S&P 500, and Bitcoin.
Why it may be useful
This indicator provides crucial historical context for understanding market behavior during economic crises, enabling traders to develop more robust risk management strategies. By visualizing past market reactions, investors can gain insights into how different assets respond to significant economic disruptions.
The tool helps traders identify potential safe-haven assets and understand long-term market resilience. It transforms complex economic data into an easily digestible visual format, supporting more informed decision-making during future potential market downturns.
When to explore it
The Economic Crises Indicator is most valuable when conducting long-term strategic analysis and comparative performance studies across different financial assets. It is particularly useful for investors seeking to understand historical market trends and potential hedging strategies during economic turbulence.
Traders can leverage this tool when developing investment approaches that consider systematic risk and asset performance during major economic events. It is especially beneficial for those interested in analyzing how gold, precious metals, cryptocurrencies, and traditional stocks react during significant market disruptions.
Keep exploring
What we’ve verified
Access, alerts and repainting behaviour have not been independently verified for this indicator. Check the creator’s current publication and settings.
General descriptions and classifications are recovered research. Verified details above identify the specific checks we have completed. Check the creator’s current publication for later changes.


