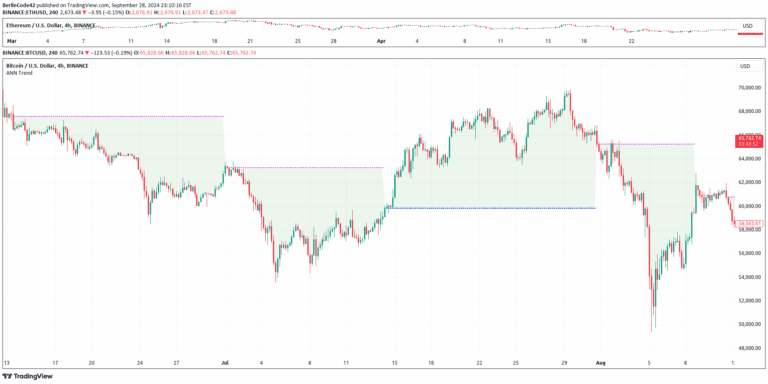
An advanced intraday trend indicator using Look Back Period and moving averages to dynamically track market trends with color-coded candles and trend lines.
Explore complementary indicator rolesHow it works
The Intraday Trend Candles (ITC) indicator operates by calculating dynamic trend limits using a combination of Look Back Period and a true range multiplier. It employs linearly weighted moving averages (LWMA) to assess price movements and determine market bias by comparing current price against these calculated thresholds.
The system generates color-coded candles that visually represent market trends: blue for bullish trends, yellow for bearish trends, and gray for indecision or trend continuation. A trend line is simultaneously plotted to provide additional clarity about price positioning relative to the calculated dynamic range.
Why it may be useful
The ITC indicator offers traders a sophisticated visual tool for understanding market momentum and trend dynamics with remarkable precision. By providing instant color-coded insights, traders can quickly interpret market sentiment without extensive technical analysis, reducing cognitive load and enabling faster decision-making.
Its adaptive nature allows traders to capture short-term price movements effectively, making it particularly valuable for momentum and trend-following strategies. The built-in alerts for trend reversals ensure traders can stay informed about critical market shifts without constant chart monitoring.
When to explore it
The Intraday Trend Candles indicator is most effective during periods of clear market directional movement, particularly in liquid and volatile markets with consistent price trends. It performs optimally in timeframes ranging from minutes to hours, making it ideal for active traders seeking to capitalize on short-term price fluctuations.
Traders should utilize this indicator during high-volume trading sessions, such as market opens or during significant economic announcements. It is especially useful in markets like forex, stocks, and cryptocurrencies where rapid price changes and short-term trends are common.
Keep exploring
What we’ve verified
Access, alerts and repainting behaviour have not been independently verified for this indicator. Check the creator’s current publication and settings.
General descriptions and classifications are recovered research. Verified details above identify the specific checks we have completed. Check the creator’s current publication for later changes.