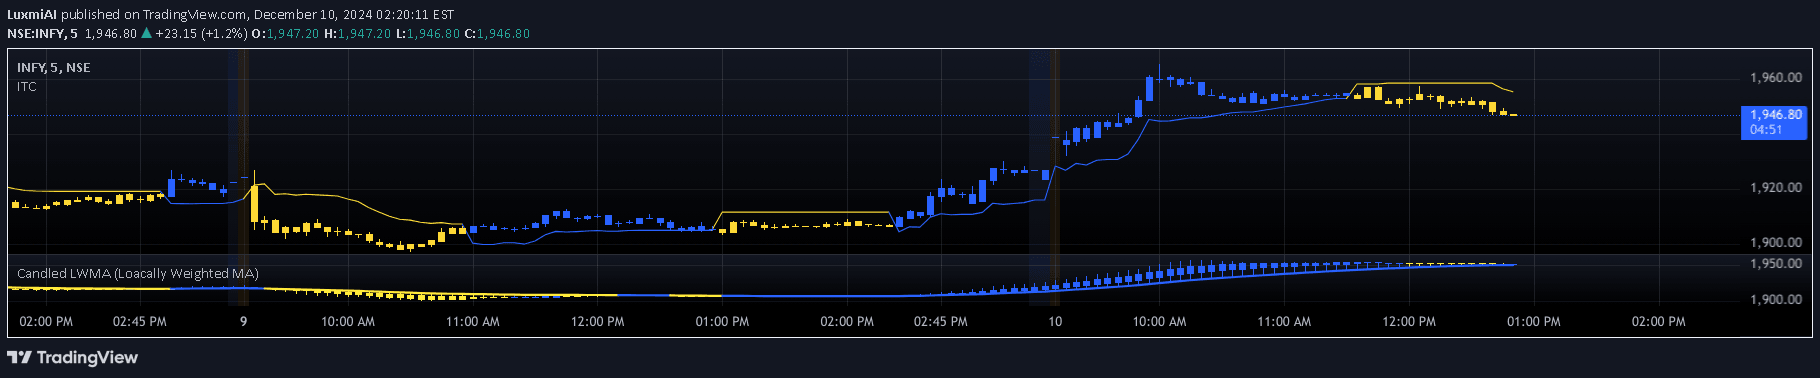
Intraday Trend Candles
An advanced intraday trend indicator using Look Back Period and moving averages to dynamically track market trends with color-coded candles and trend lines.
Explore 11,183 indicators. Filter beyond the obvious.
Discover the tools that fit the way you trade.
11,183 tools to explore
An advanced intraday trend indicator using Look Back Period and moving averages to dynamically track market trends with color-coded candles and trend lines.
A dynamic momentum indicator using Locally Weighted Moving Average that tracks price direction through a color-coded histogram and candlestick visualization, highlighting recent market movements.
The True Strength Index is a momentum oscillator that measures price change strength, helping traders identify trend direction and potential reversal points in financial markets.
A Zero-Lag Moving Average indicator that colors price candles based on trend direction, using a dual EMA calculation to reduce lag and provide clear market sentiment visualization.
The Locally Weighted Moving Average (LWMA) is a dynamic price indicator that emphasizes recent data points, providing a more responsive trend analysis compared to traditional moving averages.
A powerful trading indicator that tracks VWAP direction through a color-coded histogram, revealing market momentum and trend bias by analyzing price and volume movements.
Renko charts are a technical analysis tool that simplifies price movements by filtering out market noise, focusing on significant price changes through brick-based charting.
A trading method that applies Heikin Ashi color logic to regular OHLC candles, providing a clearer trend visualization while maintaining actual price information.
A technical indicator that normalizes RSI by dividing it by price, creating a dynamic ratio to assess market momentum and potential reversal zones with adaptive overbought/oversold thresholds.
The Intraday Chaos Filter is a dynamic indicator that helps traders identify trend shifts and filter out market noise by tracking price movements and providing clear visual signals.
VW-TWAP combines volume and time-weighted pricing to reveal market consensus, highlighting fair value zones by integrating trading activity and price movements.
A dynamic moving average tool that visualizes market momentum through color-coded bars, revealing trend direction by comparing current and historical moving average values.
Likes, views, and comments are historical TradingView snapshots. They describe attention, not trading performance.