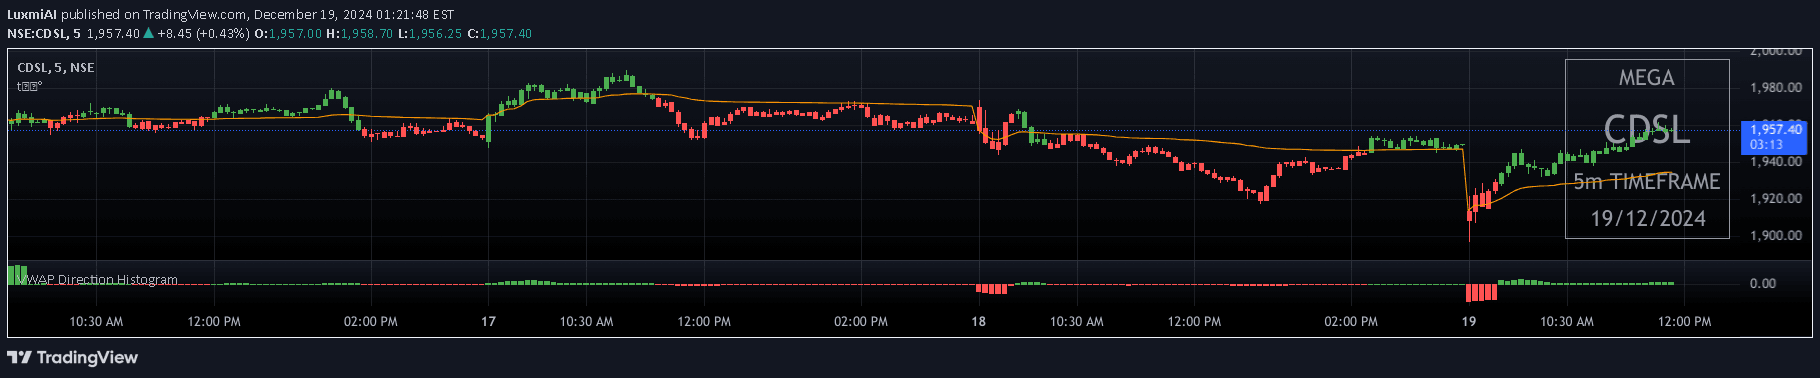
A powerful trading indicator that tracks VWAP direction through a color-coded histogram, revealing market momentum and trend bias by analyzing price and volume movements.
Explore complementary indicator rolesHow it works
The VWAP Direction Histogram calculates the Volume Weighted Average Price over a customizable lookback period, determining whether the VWAP is rising or falling. By tracking these directional changes, the indicator creates a histogram that visually represents the trend momentum of the underlying asset.
The histogram uses color coding to quickly communicate market sentiment, with different colors indicating bullish or bearish VWAP trends. Traders can easily interpret the visual representation, which shows the strength and direction of price movement weighted by trading volume.
Why it may be useful
The VWAP Direction Histogram provides traders with a nuanced view of market dynamics by combining price and volume information into a single, easy-to-understand indicator. It helps identify institutional trading activity and potential trend shifts, offering insights that go beyond traditional price-only analysis.
By integrating volume data with price movement, the indicator offers a more comprehensive market assessment. Traders can quickly gauge market sentiment, make more informed trading decisions, and align their strategies with the prevailing market trend.
When to explore it
The VWAP Direction Histogram is most effective for traders seeking to understand short-term to medium-term market momentum, particularly in highly liquid markets with significant trading volume. It works best in environments where volume can provide meaningful insights into price movement and trend strength.
Traders should utilize this indicator during active trading sessions, such as stock market hours or forex market overlaps, where volume and price dynamics are most pronounced. It is particularly useful for intraday trading strategies that rely on quick trend identification and momentum analysis.
Keep exploring
What we’ve verified
Access, alerts and repainting behaviour have not been independently verified for this indicator. Check the creator’s current publication and settings.
General descriptions and classifications are recovered research. Verified details above identify the specific checks we have completed. Check the creator’s current publication for later changes.