
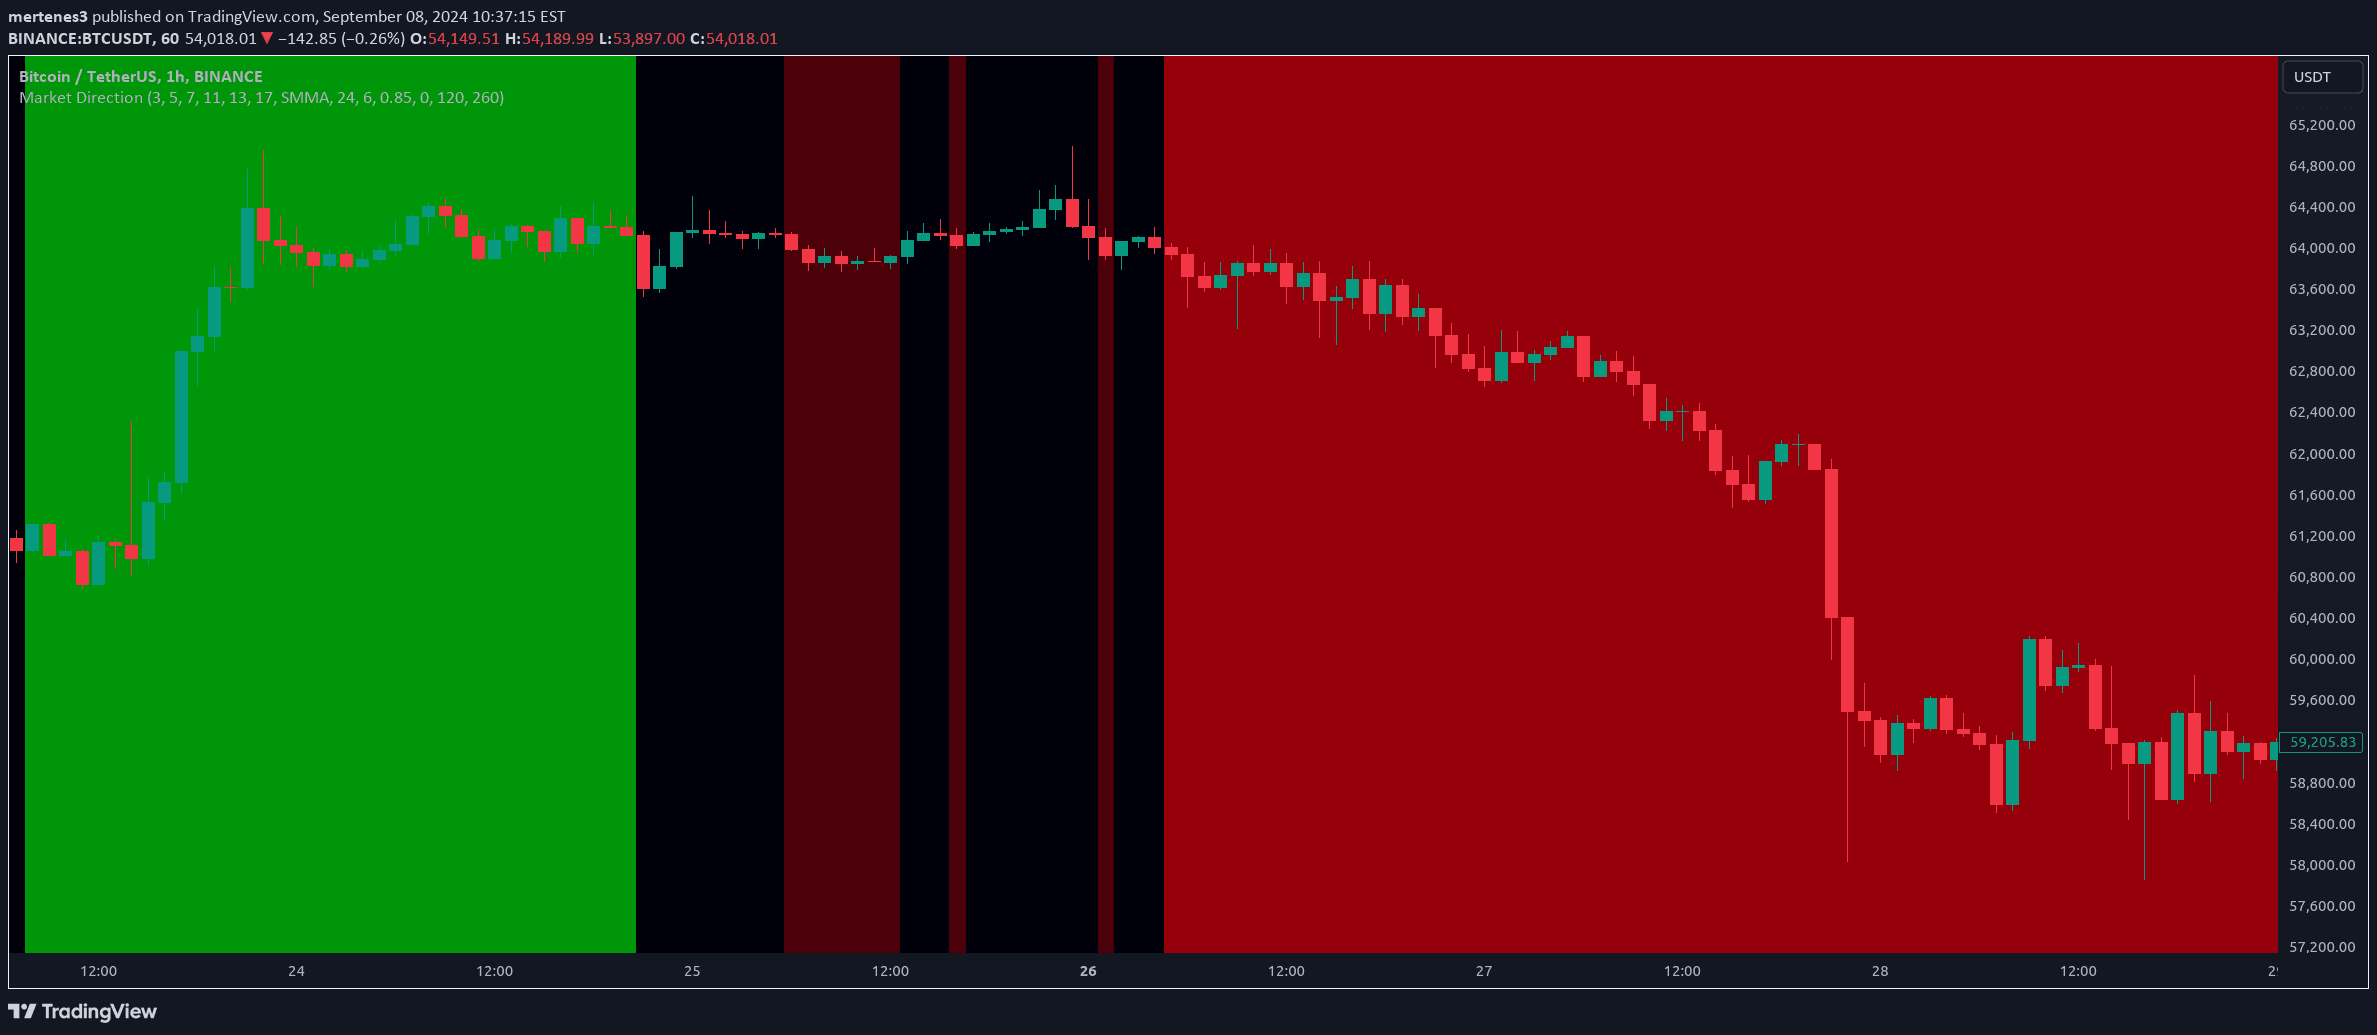
A comprehensive market direction indicator that combines four advanced sub-indicators to analyze price action, volume momentum, and market sentiment across multiple timeframes.
Explore complementary indicator rolesHow it works
The Market Direction indicator integrates four sophisticated sub-indicators to generate a comprehensive market analysis. The Fractal Indicator examines price action across six pivot lengths, identifying potential trend reversals by comparing current closing prices to significant market highs and lows.
The other three components - Volume MACD, Cumulative Volume Momentum, and POC-Price Momentum - work together to provide deeper insights. These indicators analyze volume dynamics, price movement, candlestick structures, and market sentiment to create a multi-dimensional assessment of market conditions and potential directional shifts.
Why it may be useful
This advanced indicator offers traders a holistic view of market dynamics by synthesizing multiple analytical perspectives into a single, actionable sentiment score. By combining fractal analysis, volume momentum, price action, and market depth indicators, traders can gain a more nuanced understanding of market trends and potential reversals.
The unified approach helps traders make more informed decisions by reducing individual indicator biases and providing a comprehensive market assessment. It enables traders to adapt their strategies across different timeframes and market conditions, offering enhanced insight into underlying market movements and potential trading opportunities.
When to explore it
The Market Direction indicator is most effective in markets experiencing significant price movements and complex trend formations. Traders can leverage this tool in volatile markets where traditional single-indicator approaches might provide incomplete or misleading signals.
It is particularly useful during periods of market transition, such as potential trend reversals, consolidation phases, or when multiple market forces are influencing price action. Traders across different timeframes - from scalpers to swing traders - can benefit from its multi-dimensional analysis, which helps identify potential entry and exit points with greater confidence.
Keep exploring
What we’ve verified
Access, alerts and repainting behaviour have not been independently verified for this indicator. Check the creator’s current publication and settings.
General descriptions and classifications are recovered research. Verified details above identify the specific checks we have completed. Check the creator’s current publication for later changes.




