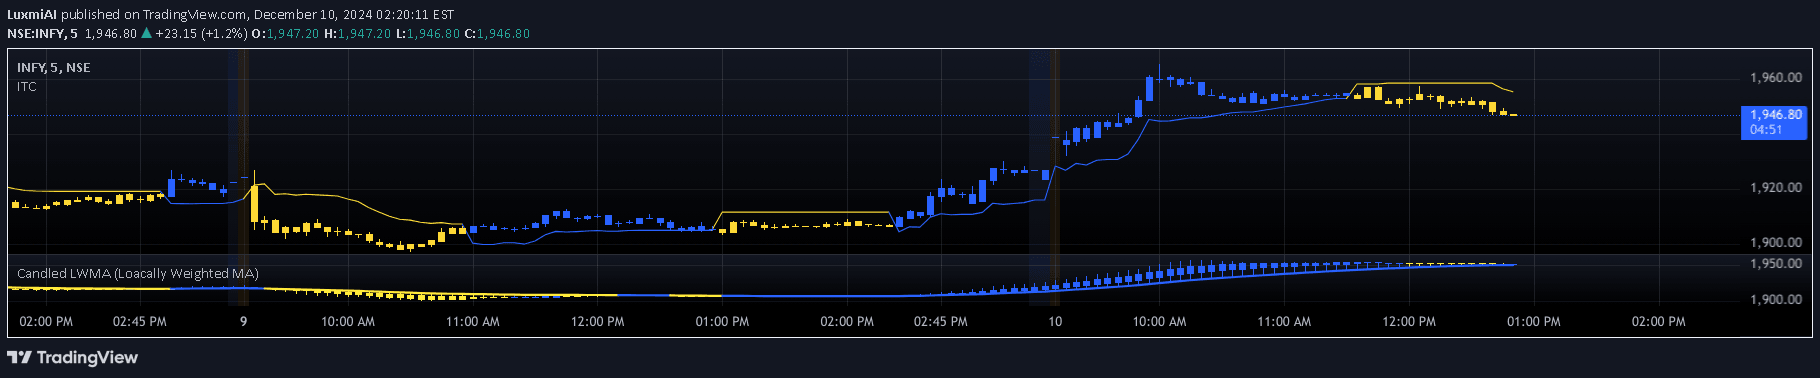
A dynamic momentum indicator using Locally Weighted Moving Average that tracks price direction through a color-coded histogram and candlestick visualization, highlighting recent market movements.
Explore complementary indicator rolesHow it works
The Locally Weighted Moving Average (LWMA) Direction Histogram calculates momentum by assigning higher weights to recent price data points, creating a more responsive trend analysis. It computes the difference between the current LWMA and a previous LWMA value, generating a histogram that visually represents price momentum.
The indicator uses color-coding to enhance interpretation, with blue representing upward momentum and yellow signaling downward movement. Traders can customize parameters like LWMA length and lookback period, allowing flexible adaptation to different market conditions and trading strategies.
Why it may be useful
This indicator provides traders with a nuanced view of market momentum by emphasizing recent price changes and visualizing trend direction through an intuitive histogram. By weighting recent data more heavily, it offers a more dynamic and responsive analysis compared to traditional moving averages.
The color-coded visualization allows traders to quickly assess market sentiment and potential trend shifts, enabling faster decision-making and more precise entry and exit points. Its flexibility in parameter settings makes it adaptable to various trading styles and market environments.
When to explore it
The LWMA Direction Histogram is most effective in markets with clear directional movements and moderate volatility, where recent price action provides meaningful insights into potential trend continuations or reversals. It performs particularly well in short to medium-term trading scenarios, such as intraday and scalping strategies.
Traders should use this indicator in conjunction with other technical analysis tools to confirm signals and reduce false positives. It is especially useful during trending market conditions, where momentum signals can provide early indications of potential trade opportunities.
Keep exploring
What we’ve verified
Access, alerts and repainting behaviour have not been independently verified for this indicator. Check the creator’s current publication and settings.
General descriptions and classifications are recovered research. Verified details above identify the specific checks we have completed. Check the creator’s current publication for later changes.