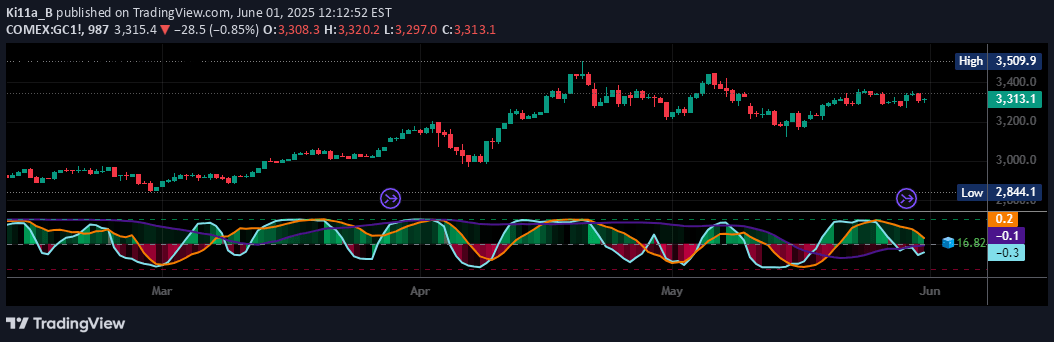
Identifies inefficient candles with potential price return zones by analyzing gaps and candle relationships, using Average True Range to filter and detect support/resistance levels.
Explore complementary indicator rolesHow it works
The signal detects inefficient candles by examining the relationship between adjacent price candles, specifically identifying instances where candles on both sides do not meet in the middle. This creates potential price return zones or areas of interest for traders. By utilizing Average True Range (ATR) with periods and multipliers between 0.01 to 1, the indicator can filter out smaller, less significant price gaps.
The methodology involves algorithmically scanning price charts to highlight these inefficient candle formations, which represent potential support and resistance levels. These areas are considered zones where price might potentially reverse or consolidate, providing traders with strategic entry and exit points based on price structure and market dynamics.
Why it may be useful
Inefficient candle analysis provides traders with unique insights into market structure and potential price behavior that traditional indicators might overlook. By identifying gaps and non-overlapping candle formations, traders can gain a deeper understanding of market sentiment and potential reversal zones. These insights help traders make more informed decisions about potential support and resistance levels.
The signal's integration with volume profile further enhances its analytical power, allowing traders to confirm low volume areas and potential price movement zones. This multi-dimensional approach helps traders identify high-probability trading opportunities by combining price structure analysis with volume confirmation.
When to explore it
The signal works best in markets with clear price structures and moderate volatility, where candle relationships can reveal meaningful trading insights. It is particularly effective in shorter timeframes like scalping and day trading, where quick identification of potential reversal zones is crucial. Traders should use this signal in conjunction with other technical indicators to confirm potential trade setups.
The indicator is most reliable when applied to liquid markets with consistent price action, such as major forex pairs, stock indices, and heavily traded commodities. Traders should adjust the ATR period and multiplier based on the specific market's characteristics and their individual trading strategy to optimize the signal's effectiveness.
Keep exploring
What we’ve verified
Access, alerts and repainting behaviour have not been independently verified for this indicator. Check the creator’s current publication and settings.
General descriptions and classifications are recovered research. Verified details above identify the specific checks we have completed. Check the creator’s current publication for later changes.