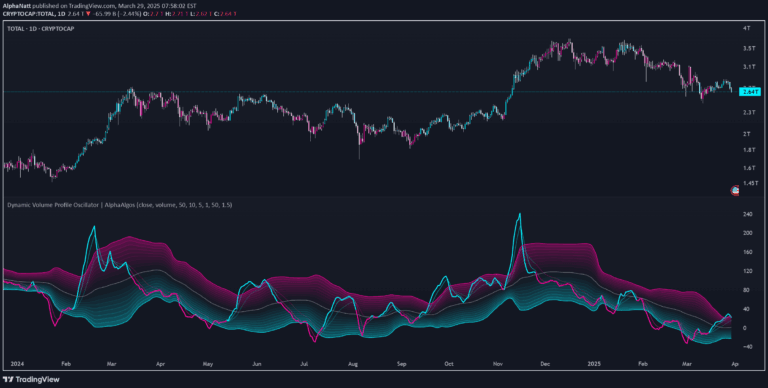
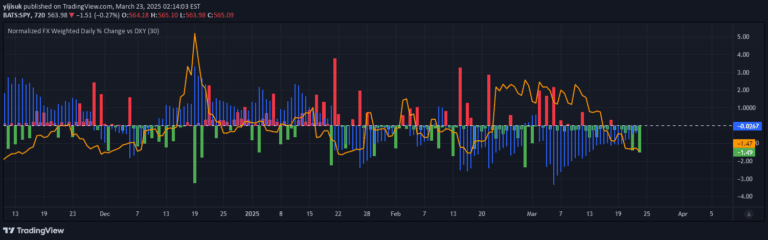
A trading indicator that compares Average True Range (ATR) to volume, highlighting price bars that meet specific volatility and trading activity criteria for potential market opportunities.
Explore complementary indicator rolesHow it works
The Effort Versus Results indicator calculates a comparative ratio between two different Average True Range (ATR) periods and average trading volume. It first computes the ratio of the first ATR to average volume and then compares this to the product of a user-defined multiplier and the second ATR divided by volume.
When the calculated condition is met, indicating that the first ATR relative to volume exceeds the second ATR relative to volume (multiplied by the specified multiplier), the indicator marks the corresponding price bars in red. This visual highlighting helps traders quickly identify potential areas of increased market volatility or trading activity.
Why it may be useful
This indicator provides traders with a unique perspective on market dynamics by combining volatility and volume measurements. By highlighting bars that meet specific criteria, it helps traders quickly identify potential trading opportunities or areas of significant market movement.
The customizable nature of the indicator allows traders to adapt it to different market conditions and trading styles. By adjusting parameters like ATR lengths and multipliers, traders can fine-tune the sensitivity of the indicator to match their specific trading strategy and risk tolerance.
When to explore it
The Effort Versus Results indicator is most effective in markets with significant price movements and varying trading volumes. It works best for traders seeking to identify potential volatility breakouts or unusual trading activity across different timeframes.
Traders should use this indicator in conjunction with other technical analysis tools and confirmation signals. It is particularly useful for short-term trading strategies like scalping and day trading, where quick identification of market dynamics can provide a competitive edge.
Keep exploring
What we’ve verified
Access, alerts and repainting behaviour have not been independently verified for this indicator. Check the creator’s current publication and settings.
General descriptions and classifications are recovered research. Verified details above identify the specific checks we have completed. Check the creator’s current publication for later changes.