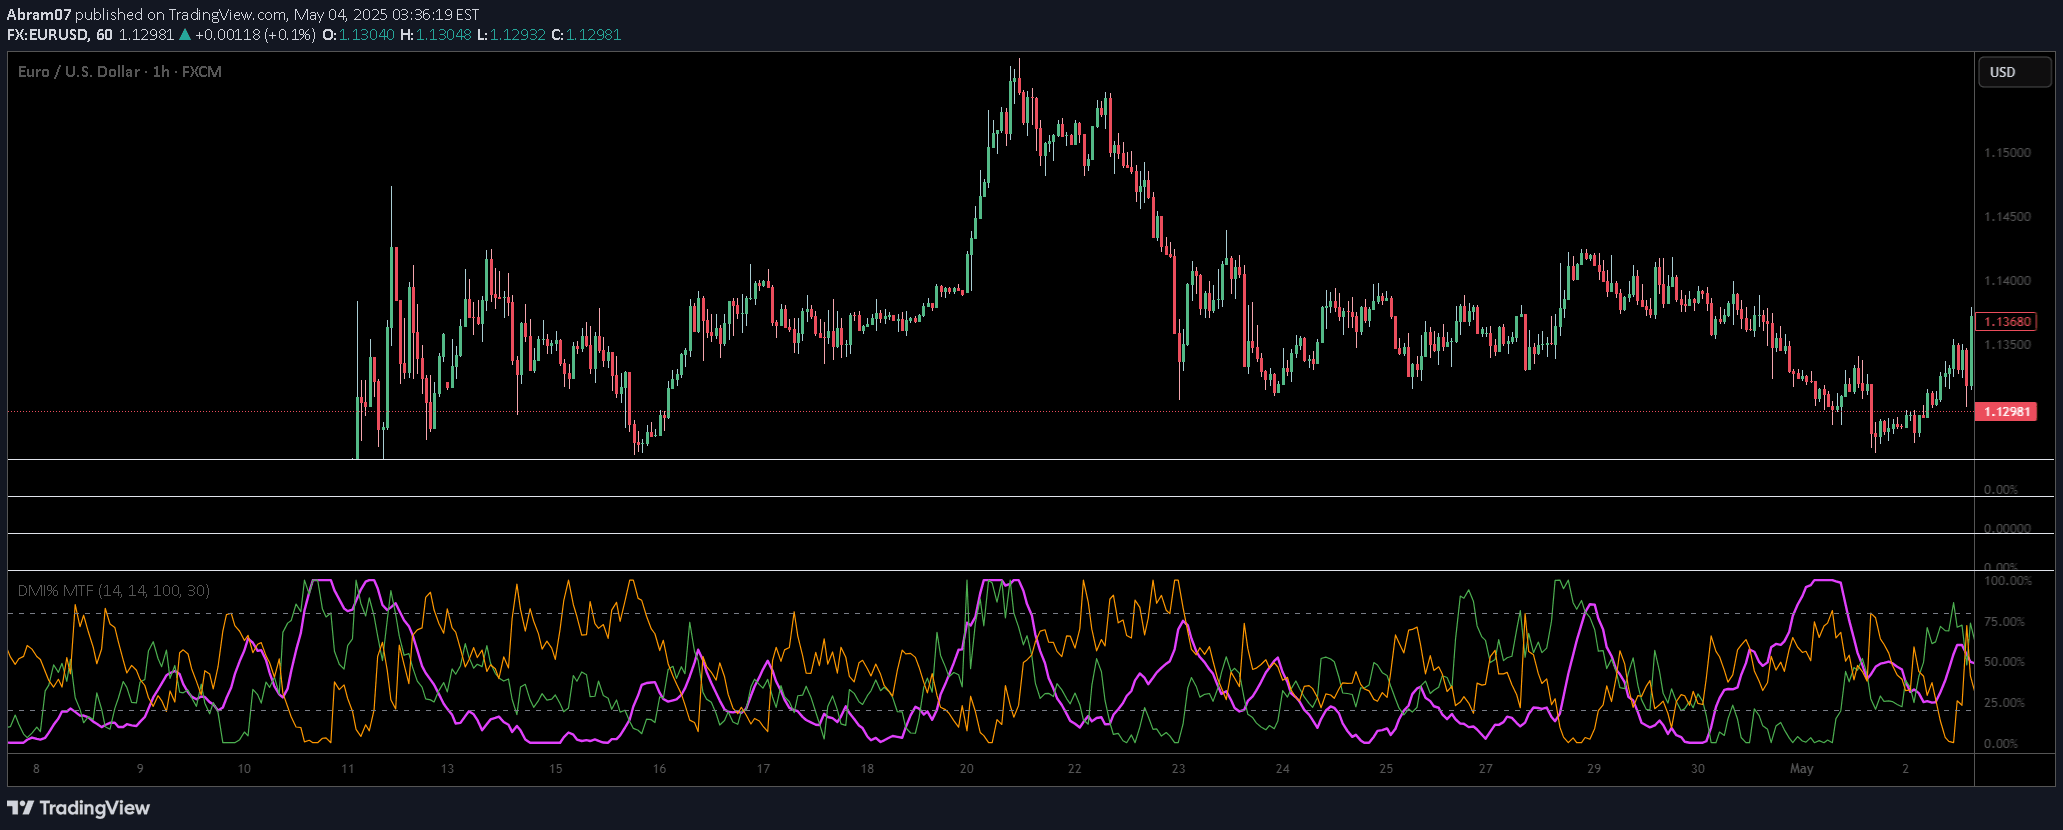
An advanced technical analysis tool combining John Ehlers' Instantaneous Trendline with ATR-based bands to identify market trends and volatility across multiple timeframes.
Explore complementary indicator rolesHow it works
The indicator operates by implementing John Ehlers' Instantaneous Trendline algorithm, which reduces lag associated with traditional moving averages and provides dynamic trend identification. It uses an advanced volatility filtering system that adapts to current market conditions, creating a multi-layered ATR band system with 18 total bands (9 upper and 9 lower).
The central trendline is calculated using a sophisticated algorithm that minimizes noise and provides real-time trend direction. Each band is color-coded with a gradient, allowing traders to quickly visualize market dynamics, with darker colors representing bands further from the central trendline.
Why it may be useful
This indicator is crucial for traders seeking a comprehensive market analysis tool that goes beyond traditional trend indicators. It provides a multi-dimensional view of market movements, combining trend direction, volatility assessment, and dynamic support/resistance levels in a single, intuitive visualization.
By integrating advanced algorithmic calculations with visual representation, traders can quickly interpret market conditions, identify potential trend changes, and assess market volatility with greater precision than conventional technical analysis tools.
When to explore it
The indicator is most effective in markets with clear trending or ranging characteristics, making it versatile across different market conditions and timeframes. It works exceptionally well for traders looking to understand both trend direction and market volatility simultaneously.
Traders can leverage this tool in various scenarios, including identifying potential trend reversals, assessing market volatility, and determining dynamic support and resistance levels. It is particularly useful for those who require a comprehensive, adaptive technical analysis tool that provides real-time market insights.
Keep exploring
What we’ve verified
Access, alerts and repainting behaviour have not been independently verified for this indicator. Check the creator’s current publication and settings.
General descriptions and classifications are recovered research. Verified details above identify the specific checks we have completed. Check the creator’s current publication for later changes.