
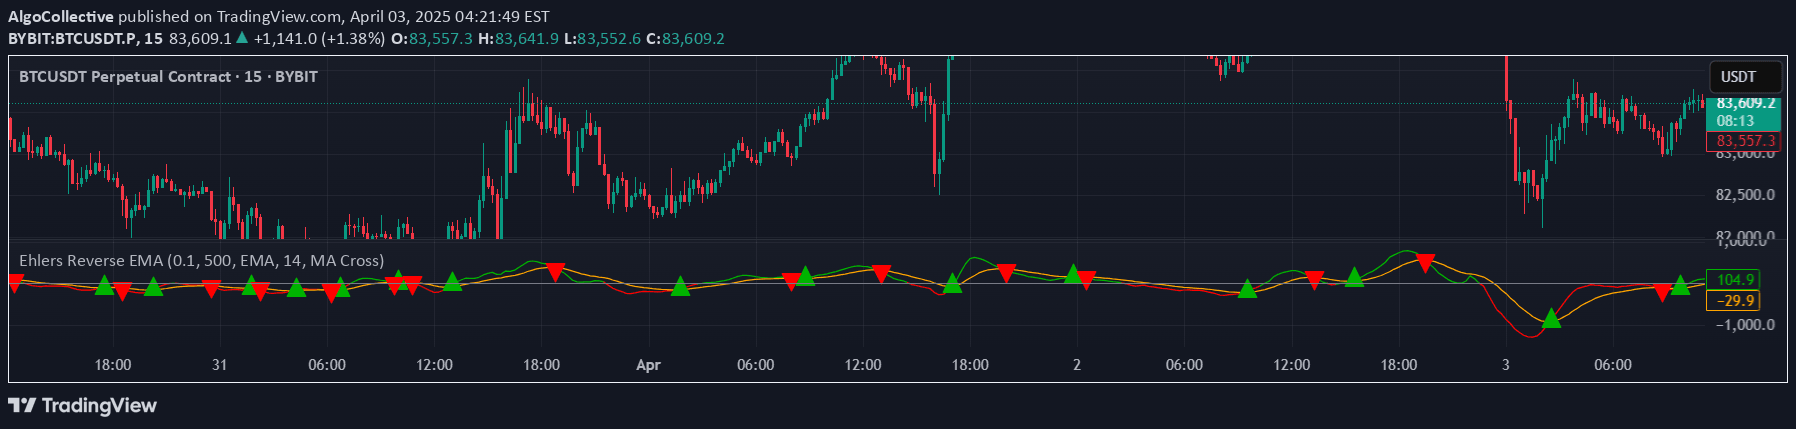
The Ehlers Reverse EMA is an advanced momentum indicator that identifies trend direction and potential reversals using a sophisticated reverse-engineering approach with dynamic color coding and multiple signal generation methods.
Explore complementary indicator rolesHow it works
The Ehlers Reverse EMA uses a proprietary reverse-engineering calculation to generate momentum signals. It calculates a dynamic EMA with an adjustable alpha value that determines the indicator's smoothness and responsiveness.
The indicator generates signals through zero-line crossovers and optional moving average confirmations. It color-codes momentum as green for positive and red for negative trends. The indicator can overlay different types of moving averages to provide additional context and confirmation for trading decisions
Why it may be useful
This indicator helps traders cut through market noise and identify high-probability trading opportunities. By combining multiple signal generation methods, it provides more robust and reliable entry and exit points. The dynamic color coding allows quick visual interpretation of market momentum.
Its flexibility in moving average selection and customizable parameters makes it adaptable to different trading styles and market conditions. The indicator helps traders make more informed decisions by providing a comprehensive view of market trends and potential reversals
When to explore it
The Ehlers Reverse EMA works best on timeframes from 5-minute to daily charts, with 4-hour and daily charts being particularly effective for swing trading. It is most useful in trending markets where clear momentum shifts can be identified.
Traders should use it in conjunction with other technical analysis tools for confirmation. The indicator is particularly valuable when markets are experiencing directional moves or potential trend reversals. It can help traders identify entry and exit points in both bullish and bearish market conditions
Keep exploring
What we’ve verified
Access, alerts and repainting behaviour have not been independently verified for this indicator. Check the creator’s current publication and settings.
General descriptions and classifications are recovered research. Verified details above identify the specific checks we have completed. Check the creator’s current publication for later changes.


