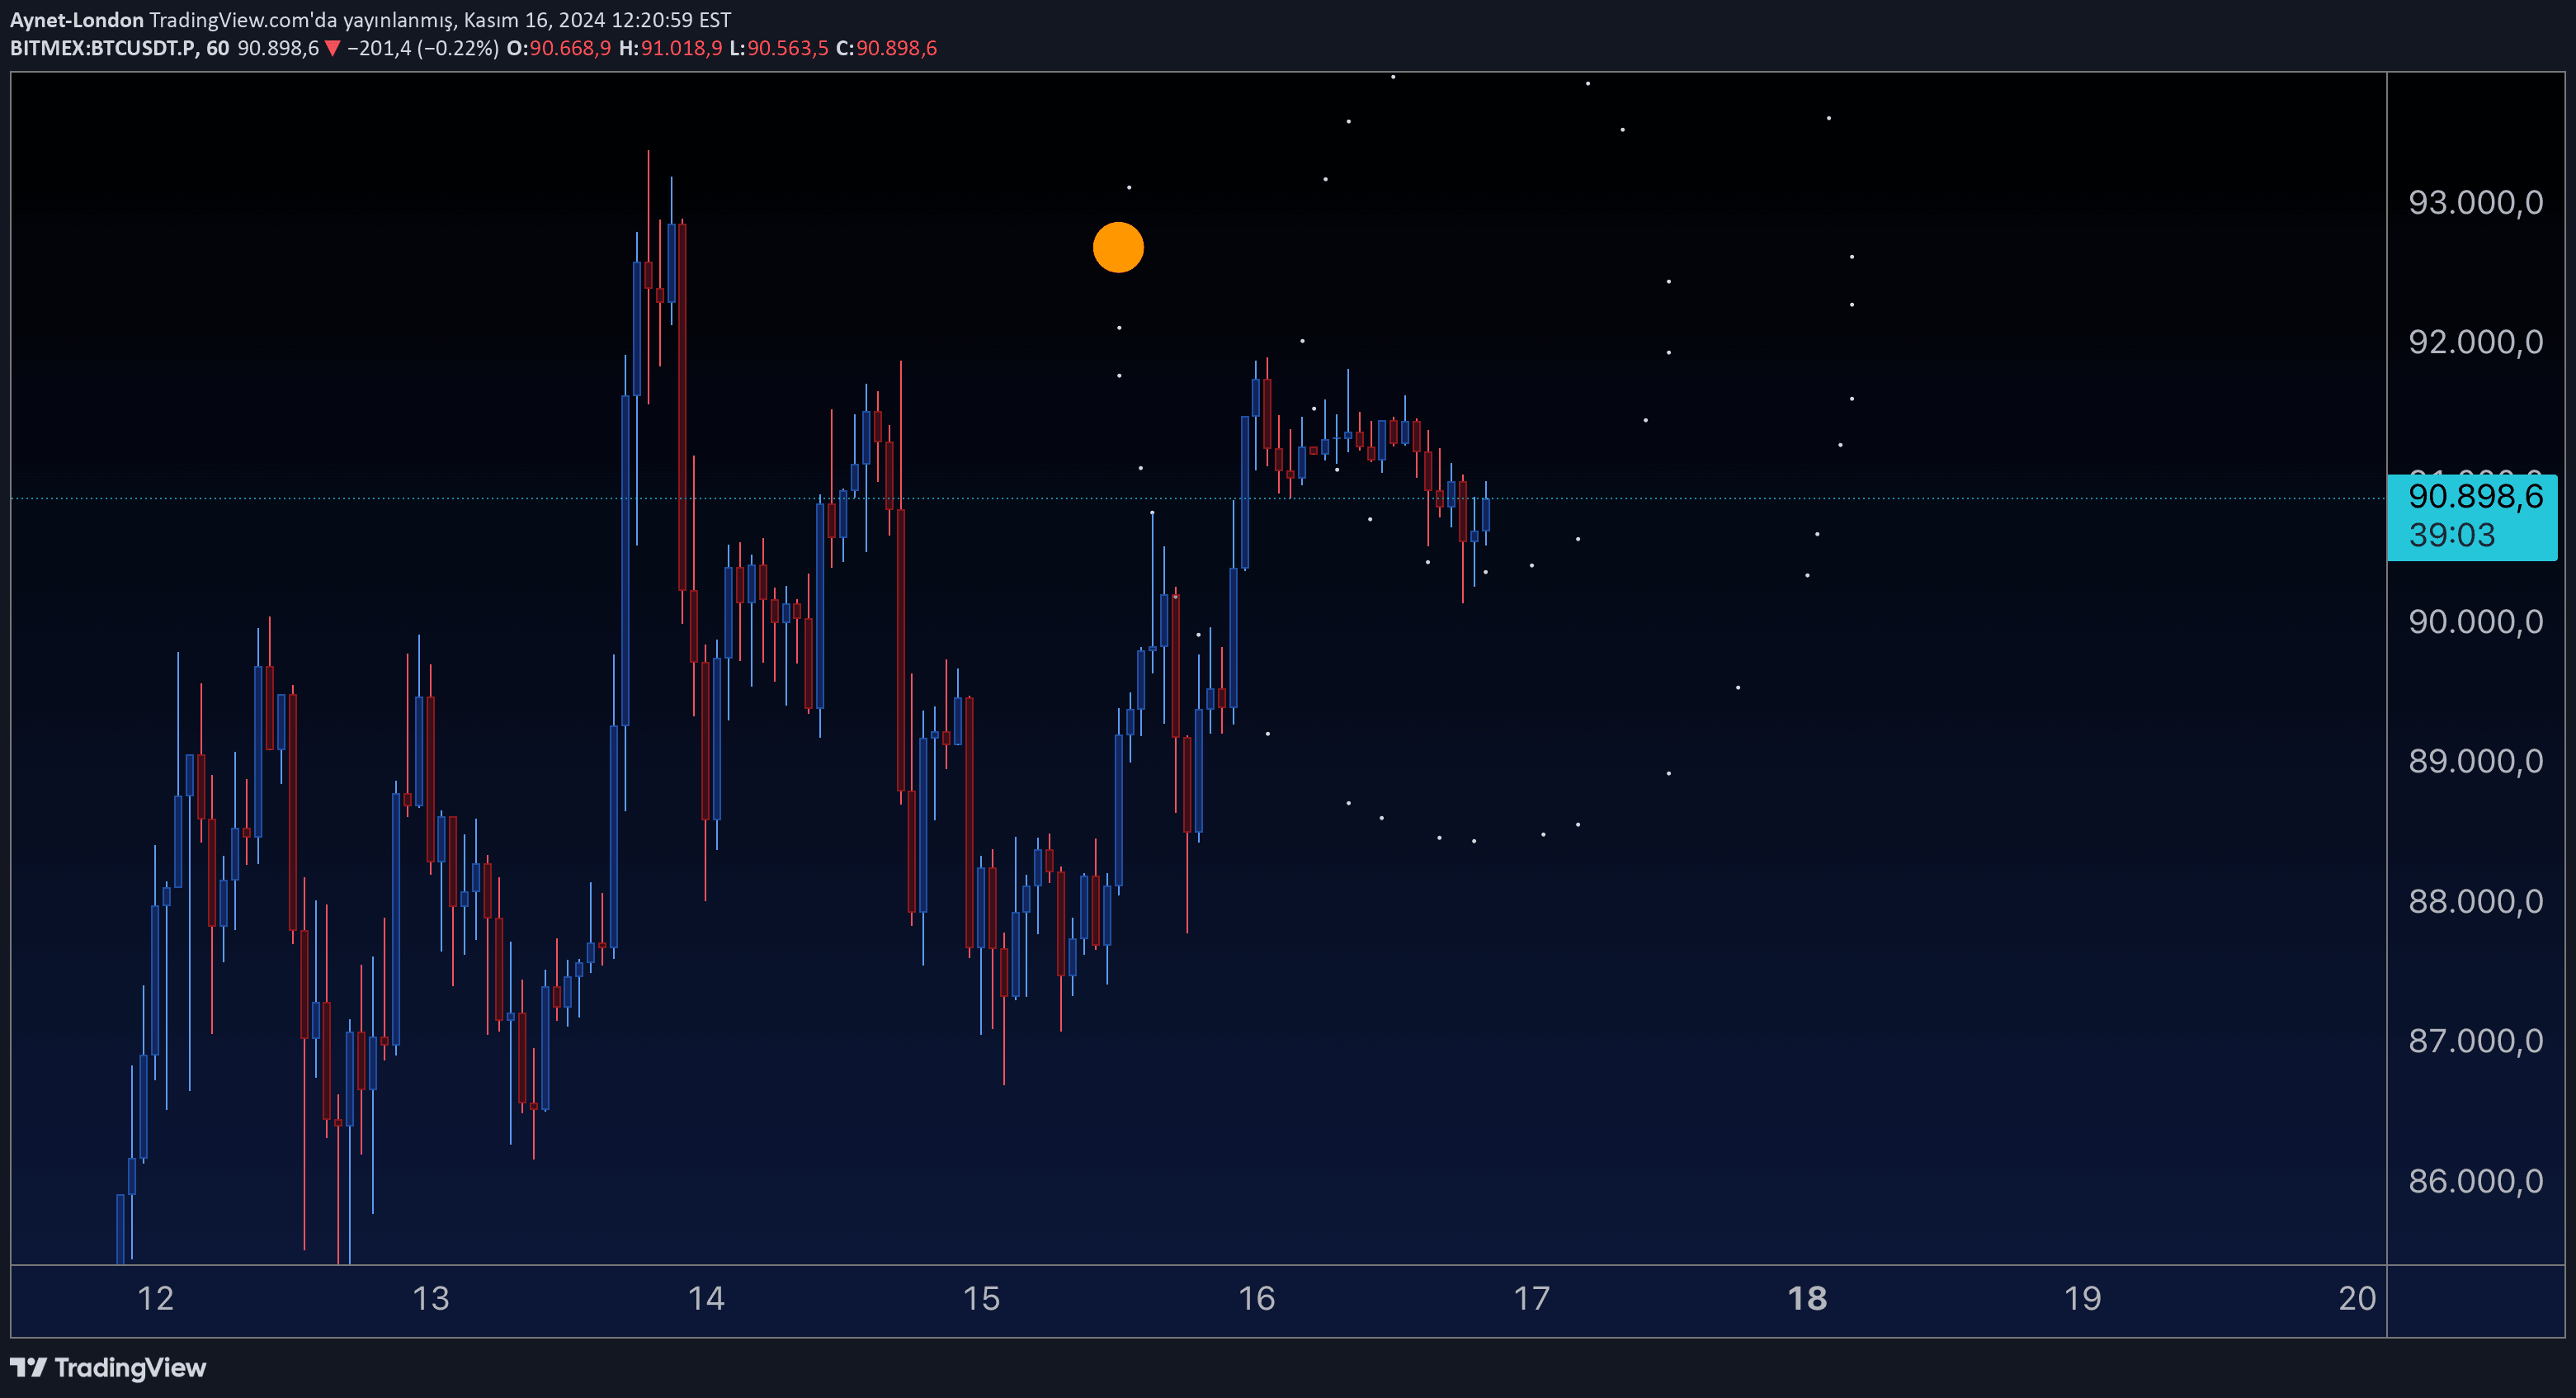
An innovative Parabolic SAR variant using elliptic curve mathematics to dynamically detect market trends with enhanced visual indicators and adaptive acceleration factors.
Explore complementary indicator rolesHow it works
The Elliptic Curve SAR indicator calculates trend direction using complex mathematical principles from elliptic curve theory. It uses a specific curve equation defined by parameters a and b, with a configurable base point to determine initial conditions.
The indicator dynamically computes acceleration through an arctan function, which allows non-linear adjustment between initial and maximum acceleration bounds. By tracking the current trend and comparing price movements, it identifies potential trend reversals and recalibrates key parameters like the Extreme Point.
Why it may be useful
Traditional trend indicators often use linear calculations that might miss nuanced market movements, whereas this elliptic curve approach provides a more sophisticated mathematical framework for trend detection. The dynamic acceleration factor allows for more adaptive signal generation that can potentially capture subtle market shifts more effectively.
By incorporating advanced mathematical principles, traders gain a more refined tool for understanding market dynamics. The visual enhancements like color-coded trends, reversal markers, and background tints provide immediate, intuitive insights into market conditions.
When to explore it
The Elliptic Curve SAR works best in markets with complex, non-linear price movements where traditional indicators might provide less precise signals. It is particularly useful in volatile markets where trend changes are frequent and subtle, requiring a more adaptive analytical approach.
Traders should consider using this indicator in markets with significant price fluctuations, such as cryptocurrency, forex, or technology stocks. Its sophisticated mathematical foundation makes it especially valuable for traders seeking a more nuanced approach to trend analysis and signal generation.
Keep exploring
What we’ve verified
Access, alerts and repainting behaviour have not been independently verified for this indicator. Check the creator’s current publication and settings.
General descriptions and classifications are recovered research. Verified details above identify the specific checks we have completed. Check the creator’s current publication for later changes.