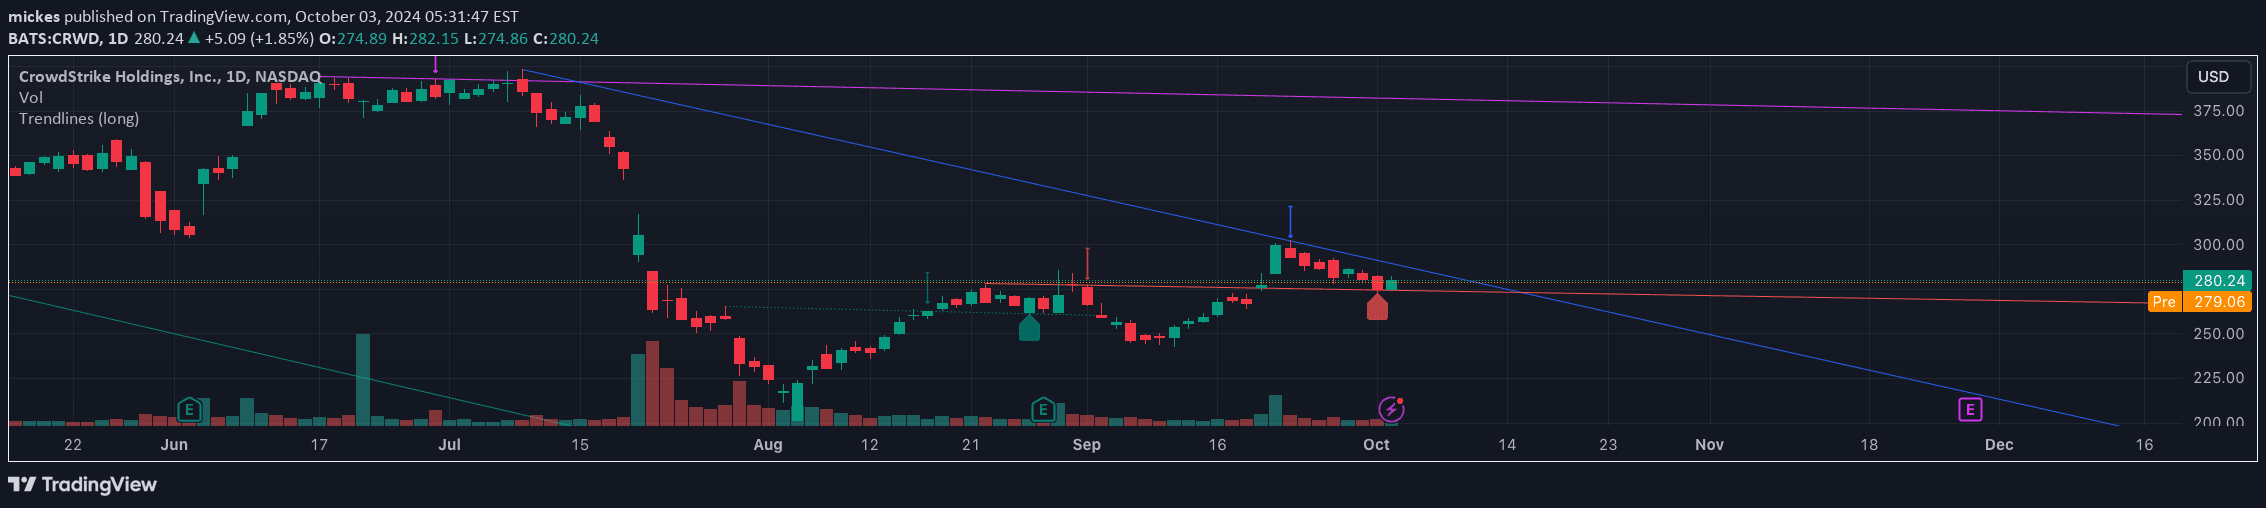
An advanced trend detection indicator using Simple Moving Averages to identify market direction and automatically plot dynamic support and resistance trendlines based on pivot points.
Explore complementary indicator rolesHow it works
The Trend and Trendline Detector uses Simple Moving Averages (SMA) to analyze market direction by calculating average price movements over configurable time periods. It identifies the major trend through a primary SMA and optionally displays a minor trend with color-coded line segments to highlight smaller price fluctuations.
Additionally, the indicator automatically detects pivot high and low points to dynamically generate support and resistance trendlines. These trendlines are rendered with different styles - solid lines for major trends and dashed lines for minor trends - and can be extended according to user-defined parameters.
Why it may be useful
Traders benefit from this indicator's comprehensive trend analysis by gaining a clear visual representation of market direction across multiple timeframes. The combination of SMA trend detection and dynamic trendline plotting provides traders with a powerful tool for understanding price momentum and potential support/resistance levels.
By offering customizable inputs and automatic pivot point detection, the indicator helps traders make more informed decisions about market entry and exit points. The flexible design allows adaptation to different trading styles and market conditions, making it a versatile analysis tool.
When to explore it
The Trend and Trendline Detector is most effective in markets with clear directional movements and identifiable trend patterns. It performs exceptionally well in trending markets where price consistently moves in a specific direction, allowing traders to align their strategies with the prevailing market momentum.
Traders should utilize this indicator when seeking to confirm trend strength, identify potential trend reversals, and discover dynamic support and resistance levels. It is particularly useful during periods of market transitions, helping traders adapt their strategies to changing price dynamics and potential breakout scenarios.
Keep exploring
What we’ve verified
Access, alerts and repainting behaviour have not been independently verified for this indicator. Check the creator’s current publication and settings.
General descriptions and classifications are recovered research. Verified details above identify the specific checks we have completed. Check the creator’s current publication for later changes.