
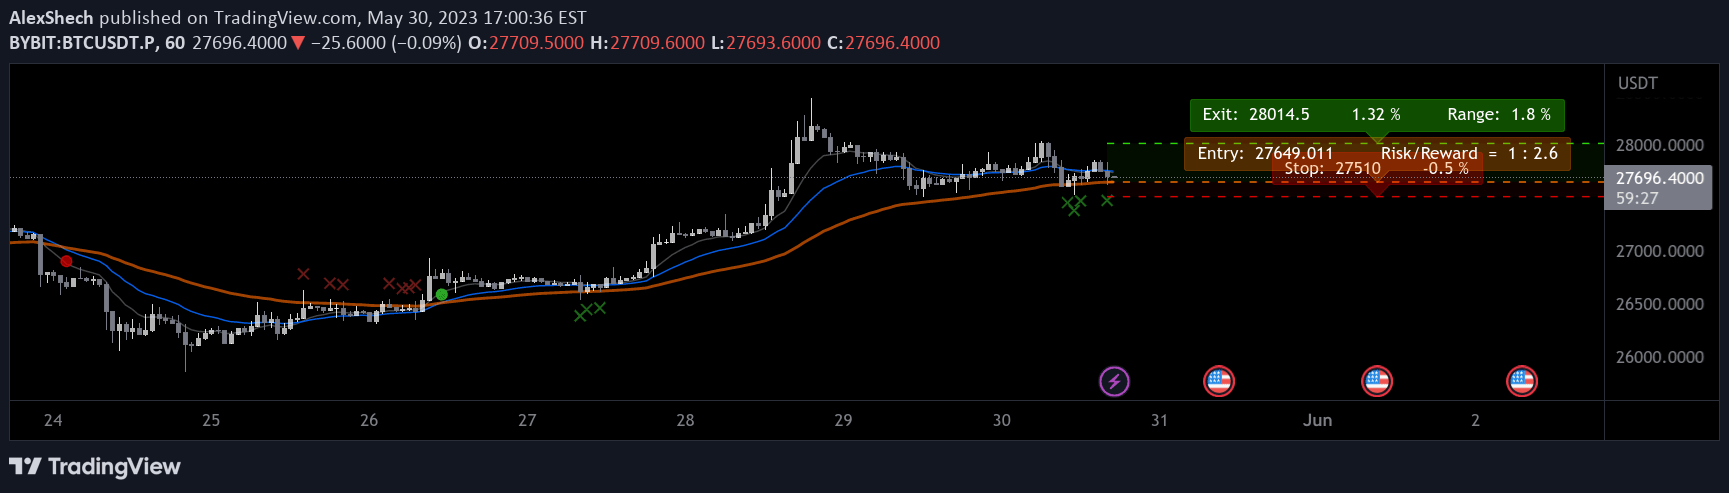
An advanced EMA cross indicator that provides dynamic trading signals, tracks trend direction, and offers key price level insights across multiple assets and timeframes.
Explore complementary indicator rolesHow it works
The Improved EMA Cross Pro Indicator operates by tracking exponential moving average (EMA) crosses and price interactions with the 55 EMA. It generates color-coded signals for bullish and bearish crosses, with green indicating a bull cross and red signaling a bear cross. The indicator dynamically adapts to current market trends, identifying potential entry and exit points based on price movements relative to the 55 EMA.
Additionally, the indicator plots critical horizontal levels including the current 55 EMA position, recent high and low prices, and calculates important trading metrics. These metrics include percentage distance from the 55 EMA, risk/reward ratios, and range analysis between price highs and lows.
Why it may be useful
This indicator simplifies complex technical analysis by automatically highlighting key trading information that traders would otherwise need to calculate manually. By providing instant visual cues about trend direction, potential entry/exit points, and risk management parameters, it helps traders make more informed decisions quickly and efficiently.
The indicator's adaptive nature means it can work across different assets and timeframes, making it a versatile tool for traders with varying strategies and market preferences. Its built-in risk management warnings help traders avoid unfavorable trade setups, potentially preventing unnecessary losses and promoting more disciplined trading.
When to explore it
The EMA Cross Pro Indicator is most effective in trending markets where clear directional movement is present. Traders can utilize this tool when seeking to identify trend changes, confirm potential entry and exit points, and assess the overall market momentum across different timeframes and assets.
It is particularly useful for traders who want a comprehensive view of market structure, including recent highs and lows, percentage distances, and risk-reward calculations. The indicator's flexibility allows traders to customize settings to match their specific trading style, making it adaptable to various market conditions and personal trading preferences.
Keep exploring
What we’ve verified
Access, alerts and repainting behaviour have not been independently verified for this indicator. Check the creator’s current publication and settings.
General descriptions and classifications are recovered research. Verified details above identify the specific checks we have completed. Check the creator’s current publication for later changes.


