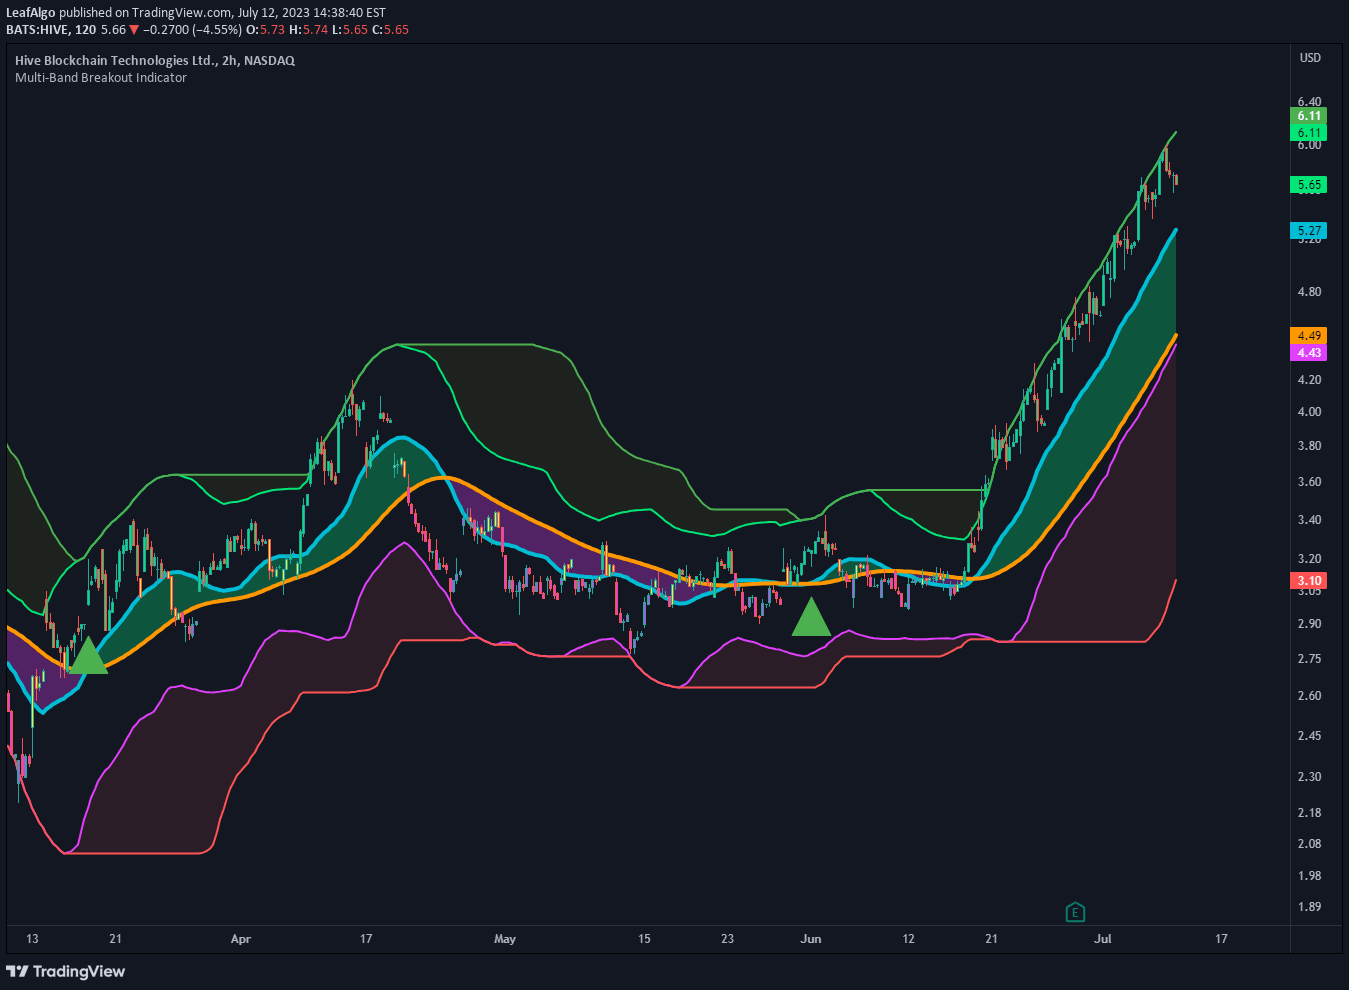
EMA Pullback & Trend Indicator uses five exponential moving averages to identify trend direction and generate entry and exit signals based on specific crossover conditions.
Explore complementary indicator rolesHow it works
The EMA Pullback & Trend Indicator uses five exponential moving averages (9, 15, 30, 65, and 200) to analyze market trends and generate trading signals. It first establishes the overall trend by comparing price to the 65 and 200 EMAs, determining whether the market is in a bullish or bearish regime.
Signals are generated when the fast EMAs (9 and 15) cross, but only under specific conditions. For a long entry, the EMA 9 must cross above EMA 15 while the price is above both 65 and 200 EMAs and has pulled back to the EMA 30 or 65 zones. Conversely, short entries occur when the opposite conditions are met.
Why it may be useful
The EMA Pullback & Trend Indicator provides traders with a clear, systematic approach to identifying potential trade opportunities by combining trend analysis and precise entry conditions. By using multiple moving averages, it offers a more comprehensive view of market dynamics compared to single-indicator strategies.
The indicator's strength lies in its ability to filter out false signals by requiring specific trend and pullback conditions. This approach helps traders avoid entering trades against the primary market trend and increases the probability of successful trades by waiting for confirmatory price action.
When to explore it
The EMA Pullback & Trend Indicator is most effective in trending markets with clear directional movement. It works best on timeframes that allow for sufficient price movement and pullback opportunities, such as daily or 4-hour charts for swing trading and intraday charts for day trading.
Traders should be cautious during periods of high market volatility or choppy, range-bound conditions where trend signals may be less reliable. The indicator is particularly useful for traders who prefer a systematic, rules-based approach to market analysis and want to identify potential entry and exit points with a structured methodology.
Keep exploring
What we’ve verified
Access, alerts and repainting behaviour have not been independently verified for this indicator. Check the creator’s current publication and settings.
General descriptions and classifications are recovered research. Verified details above identify the specific checks we have completed. Check the creator’s current publication for later changes.