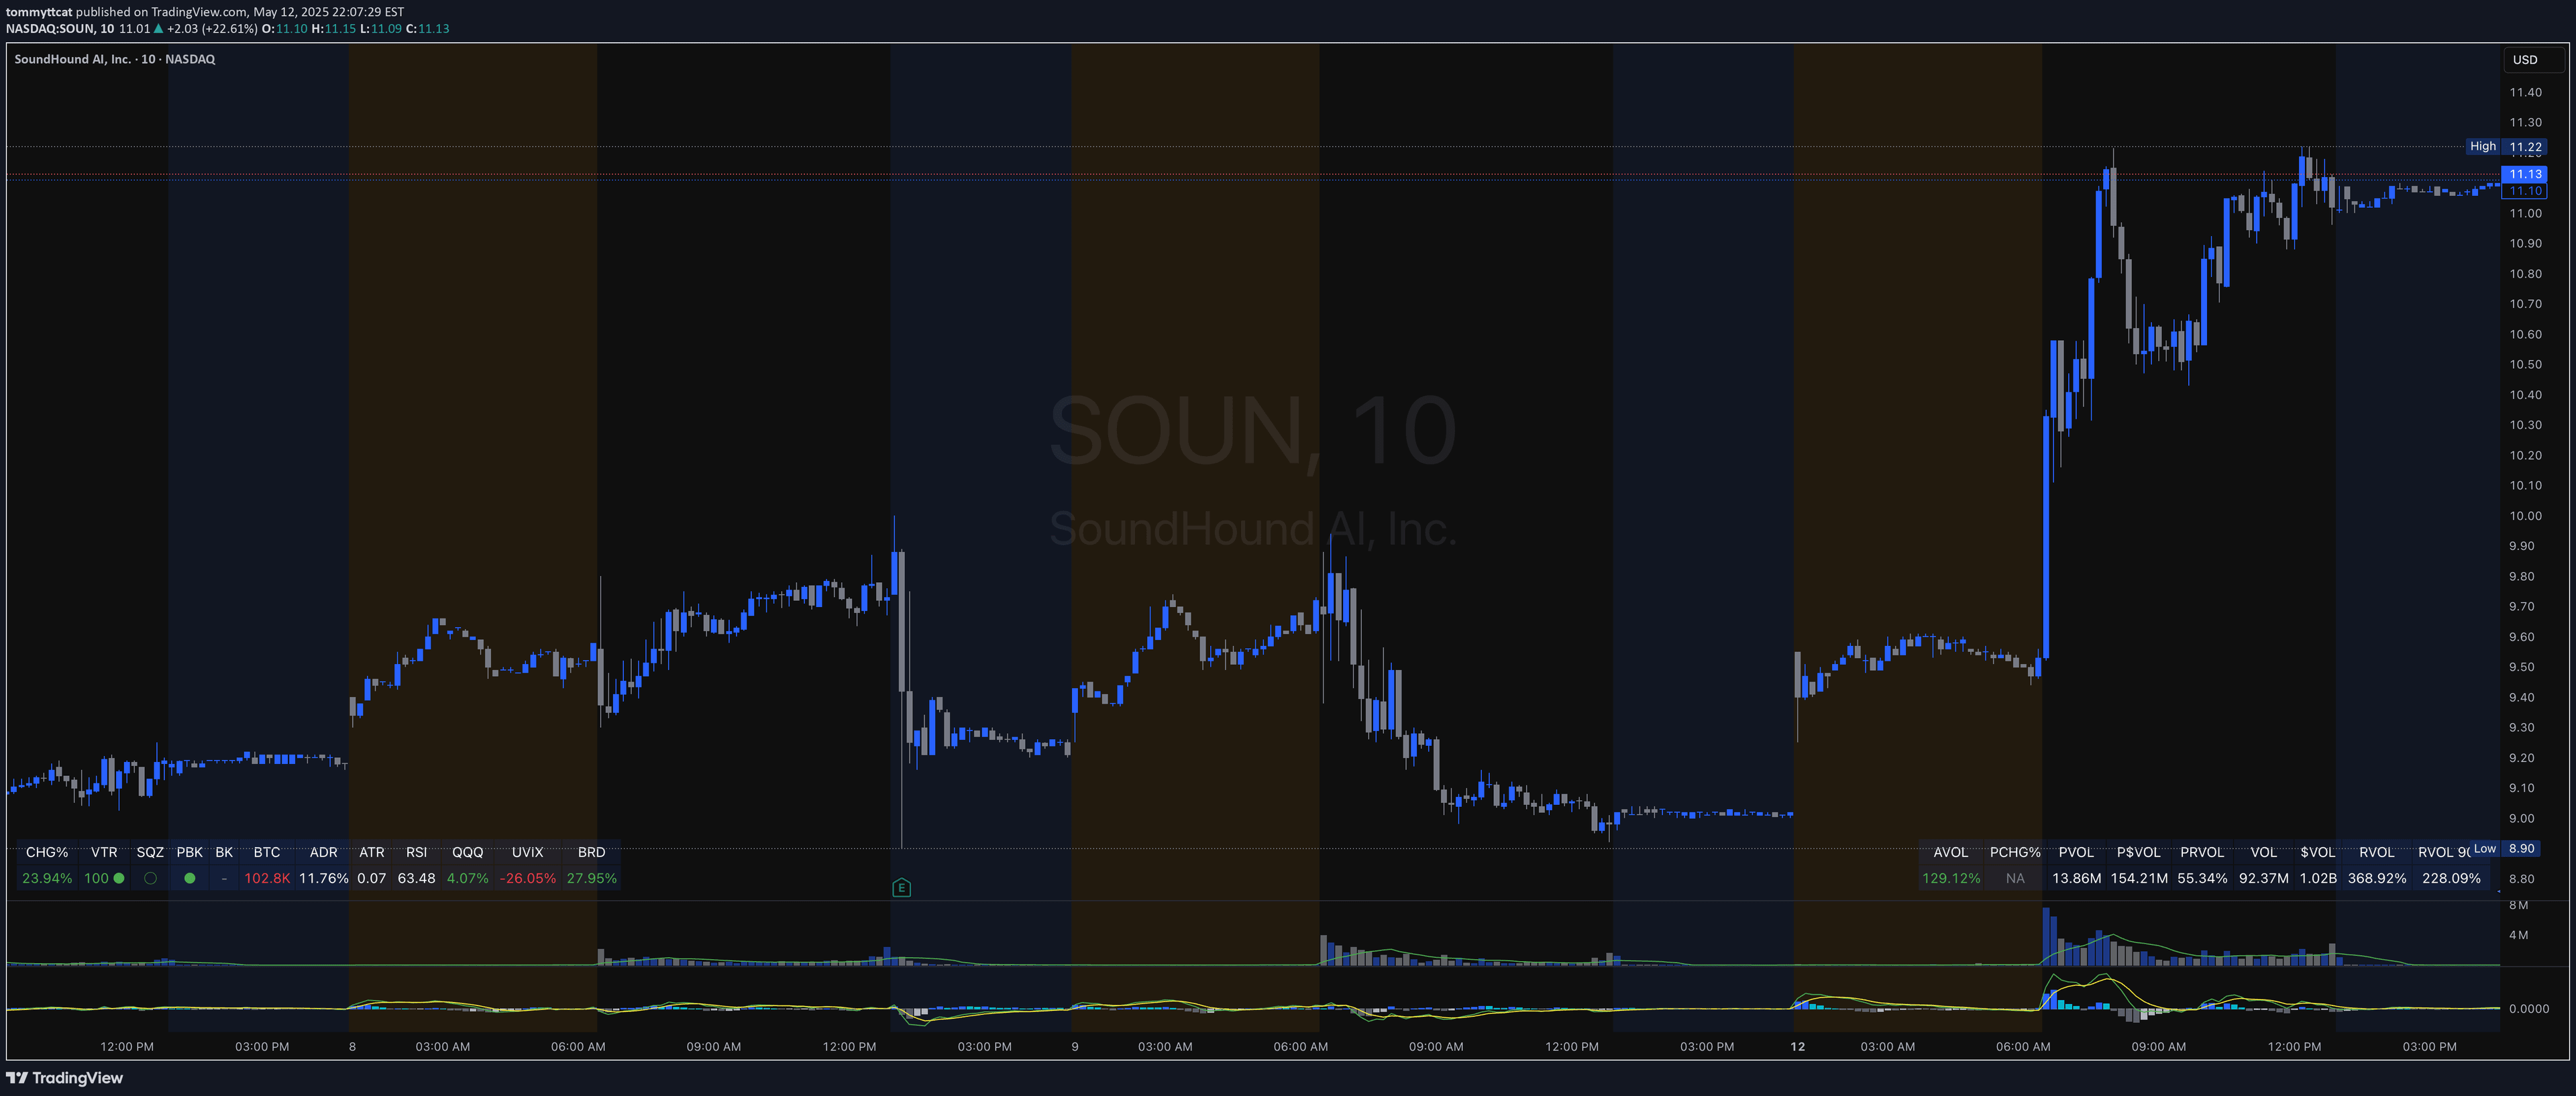
The EMA Ribbon is a multi-period moving average indicator that reveals trend direction and strength by plotting color-coded exponential moving averages across different timeframes.
Explore complementary indicator rolesHow it works
The EMA Ribbon works by plotting eight exponential moving averages with periods ranging from 20 to 55, creating a gradient ribbon effect on the price chart. Each EMA is color-coded to visually represent different time periods, allowing traders to quickly assess trend dynamics and momentum. The ribbon's arrangement provides an instant visual representation of market movement.
Additionally, a thick 100-period EMA is added as a key long-term trend indicator. When shorter-period EMAs are stacked above longer-period EMAs, it indicates an uptrend, while the opposite suggests a downtrend. The ribbon's configuration helps traders identify trend strength, potential support/resistance levels, and overall market sentiment.
Why it may be useful
The EMA Ribbon matters because it offers traders a comprehensive and visually intuitive method of analyzing market trends across multiple timeframes simultaneously. By consolidating multiple moving averages into a single, color-coded display, traders can quickly interpret complex market dynamics without overwhelming technical analysis.
Its versatility allows traders to adapt the indicator to various trading styles and timeframes, making it a powerful tool for trend identification, momentum assessment, and potential entry/exit point recognition. The customizable nature of the EMA Ribbon enables traders to fine-tune the indicator to their specific trading strategy and risk management approach.
When to explore it
The EMA Ribbon is most effective during trending market conditions, where clear directional movements are present. In strong uptrends or downtrends, the stacked EMAs provide clear visual confirmation of market momentum, helping traders make more informed decisions about potential trade entries and exits.
Traders should use the EMA Ribbon as a complementary tool alongside other technical indicators for confirmation. It works particularly well in markets with consistent trends, such as forex, stocks, and cryptocurrencies. The indicator is less reliable during choppy, range-bound market conditions where EMAs become intertwined and provide less clear signals.
Keep exploring
What we’ve verified
Access, alerts and repainting behaviour have not been independently verified for this indicator. Check the creator’s current publication and settings.
General descriptions and classifications are recovered research. Verified details above identify the specific checks we have completed. Check the creator’s current publication for later changes.