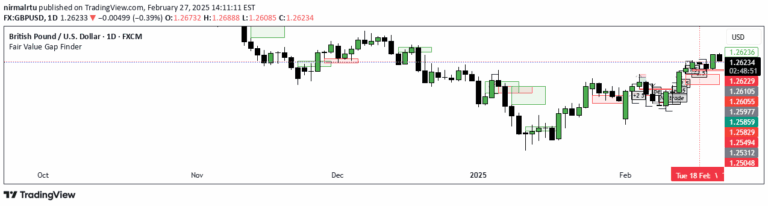
A multi-timeframe indicator tracking Failed to Return (FTR) scenarios, identifying potential trend reversals by analyzing single bearish or bullish candles across different timeframes.
Explore complementary indicator rolesHow it works
The Failed to Return (FTR) indicator analyzes price action across multiple timeframes to identify potential trend reversal points. It focuses on single bearish candles in an uptrend or single bullish candles in a downtrend as key signal markers.
By allowing users to customize the number of updated boxes and select specific timeframes, the indicator provides flexibility in trend analysis. Traders can set custom timeframe configurations to match their specific trading strategy and market interpretation.
Why it may be useful
The multi-timeframe FTR indicator helps traders gain a more comprehensive view of potential trend reversals by examining price action across different time horizons. This approach reduces the risk of making trading decisions based on limited perspective and provides a more robust analysis of market movements.
By identifying potential trend exhaustion points, the indicator allows traders to make more informed entry and exit decisions. It offers a systematic approach to recognizing when a trend might be losing momentum, which can be crucial for managing risk and capturing potential trend change opportunities.
When to explore it
The FTR indicator is most effective in trending markets with clear directional movement, where single candles can signal potential trend exhaustion or reversal. It works particularly well in markets with distinct bullish or bearish momentum, helping traders identify critical turning points.
Traders should use this indicator in conjunction with other technical analysis tools to confirm signals and reduce false positives. It is especially useful for traders who want to capture trend reversals early and manage their positions with a more nuanced, multi-timeframe approach.
Keep exploring
What we’ve verified
Access, alerts and repainting behaviour have not been independently verified for this indicator. Check the creator’s current publication and settings.
General descriptions and classifications are recovered research. Verified details above identify the specific checks we have completed. Check the creator’s current publication for later changes.