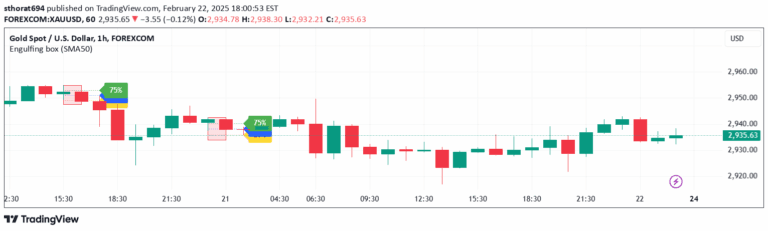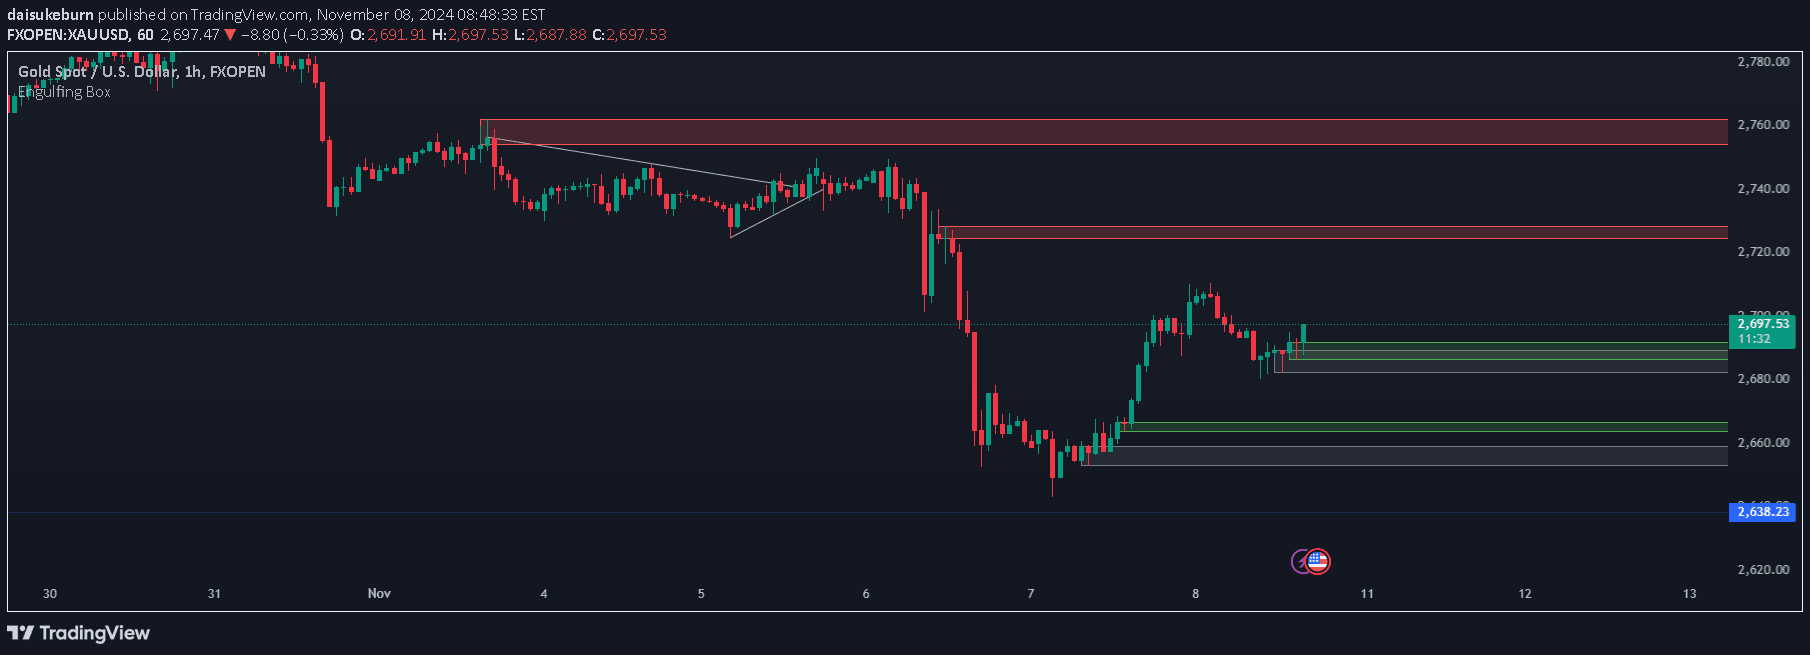
A custom trading indicator that identifies and highlights bullish and bearish engulfing candlestick patterns by drawing colored boxes around specific price action formations.
Explore complementary indicator rolesHow it works
The Engulfing Box indicator analyzes consecutive candlesticks to detect specific pattern formations where one candle completely engulfs the previous candle. For bullish patterns, it checks if the current candle's close is higher than the previous candle's open, and its open is lower than the previous candle's close. Conversely, for bearish patterns, it verifies if the current candle's close is lower than the previous candle's open, with its open higher than the previous candle's close.
Once a pattern is detected, the script dynamically draws a colored box around the engulfing candle to visually highlight the potential reversal signal. The boxes are color-coded green for bullish and red for bearish patterns, with a transparent background to maintain chart visibility. The indicator continuously monitors these boxes, adjusting their appearance or removing them based on subsequent price action.
Why it may be useful
The Engulfing Box indicator provides traders with a visual tool to quickly identify potential trend reversal points in price action. By highlighting specific candlestick patterns, it helps traders recognize moments when market sentiment might be shifting from bullish to bearish or vice versa. The color-coded boxes make it easier to spot these critical chart formations, which can be challenging to detect manually.
Moreover, the indicator's dynamic management system ensures that outdated or less relevant patterns are automatically removed or adjusted. This feature helps traders focus on the most recent and potentially significant market signals, reducing visual clutter and allowing for more efficient decision-making. The customizable nature of the indicator also allows traders to adapt it to their specific trading style and preferences.
When to explore it
The Engulfing Box indicator is most effective in markets with clear trending or ranging conditions, where candlestick patterns can provide meaningful insights into potential trend reversals. It works particularly well in liquid markets with sufficient price volatility, such as major forex pairs, stock indices, and actively traded commodities. Traders should use this indicator in conjunction with other technical analysis tools to confirm signals and reduce false positives.
The indicator is especially useful for traders who focus on short to medium-term price movements and want to capture potential trend changes quickly. It can be applied across various timeframes, from intraday charts for scalpers and day traders to daily and weekly charts for swing traders. However, traders should always combine this indicator with additional confirmation signals, risk management strategies, and a comprehensive understanding of market context.
Keep exploring
What we’ve verified
Access, alerts and repainting behaviour have not been independently verified for this indicator. Check the creator’s current publication and settings.
General descriptions and classifications are recovered research. Verified details above identify the specific checks we have completed. Check the creator’s current publication for later changes.