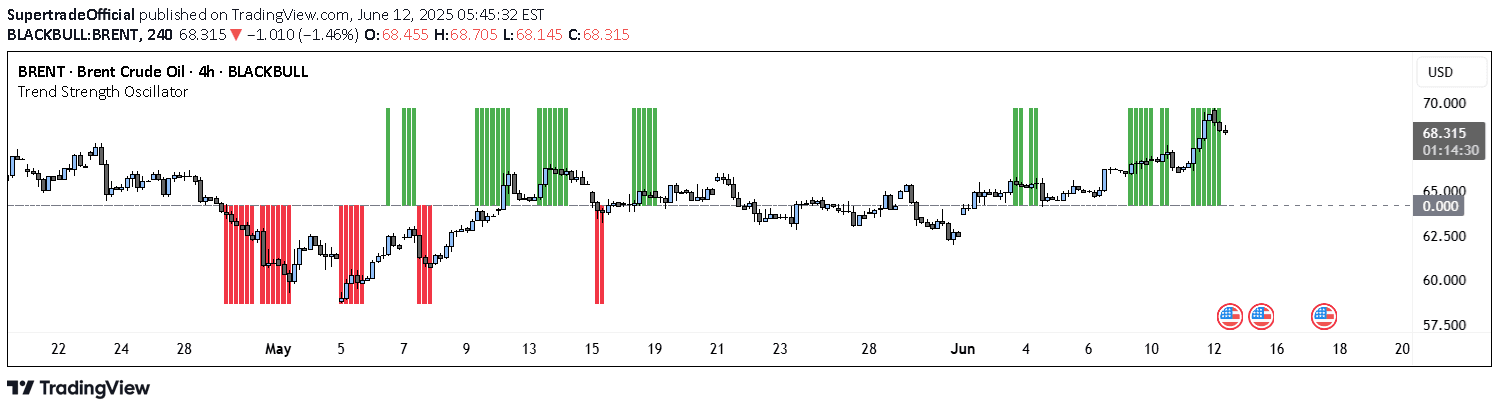
An advanced trading strategy that identifies market structure changes using break of structure (BOS) detection, volume filtering, and EMA analysis to generate precise entry and exit signals.
Explore complementary indicator rolesHow it works
The Enhanced BOS Strategy detects market structure changes by analyzing pivot points and identifying bullish or bearish break of structure (BOS) signals. It uses a custom pivot period to determine potential trend reversals or continuations, with specific criteria for entry points.
The strategy incorporates volume filtering to ensure only trades within a specified volume range are considered, reducing false signals. Additionally, it calculates dynamic stop loss and take profit levels, which are visualized on the chart to help traders manage their risk and potential profit targets.
Why it may be useful
This strategy provides traders with a comprehensive approach to identifying market opportunities by combining multiple analytical techniques into a single, powerful tool. By integrating break of structure detection, volume analysis, and exponential moving averages, traders can gain a more nuanced understanding of potential market movements.
The visual EMA table and dynamic SL/TP levels offer traders enhanced decision-making capabilities, allowing for more precise trade execution and risk management. This approach helps traders move beyond simple trend following and develop a more sophisticated understanding of market structure and momentum.
When to explore it
The Enhanced BOS Strategy is most effective in markets with clear trending characteristics and sufficient trading volume. It works best on standard bar or candlestick charts where price movements can be clearly analyzed and pivot points can be reliably identified.
Traders should consider using this strategy in markets that demonstrate consistent directional movement, such as forex, futures, or liquid stock markets. It is particularly useful for traders who want a systematic approach to identifying potential entry and exit points that goes beyond traditional trend-following methods.
Keep exploring
What we’ve verified
Access, alerts and repainting behaviour have not been independently verified for this indicator. Check the creator’s current publication and settings.
General descriptions and classifications are recovered research. Verified details above identify the specific checks we have completed. Check the creator’s current publication for later changes.