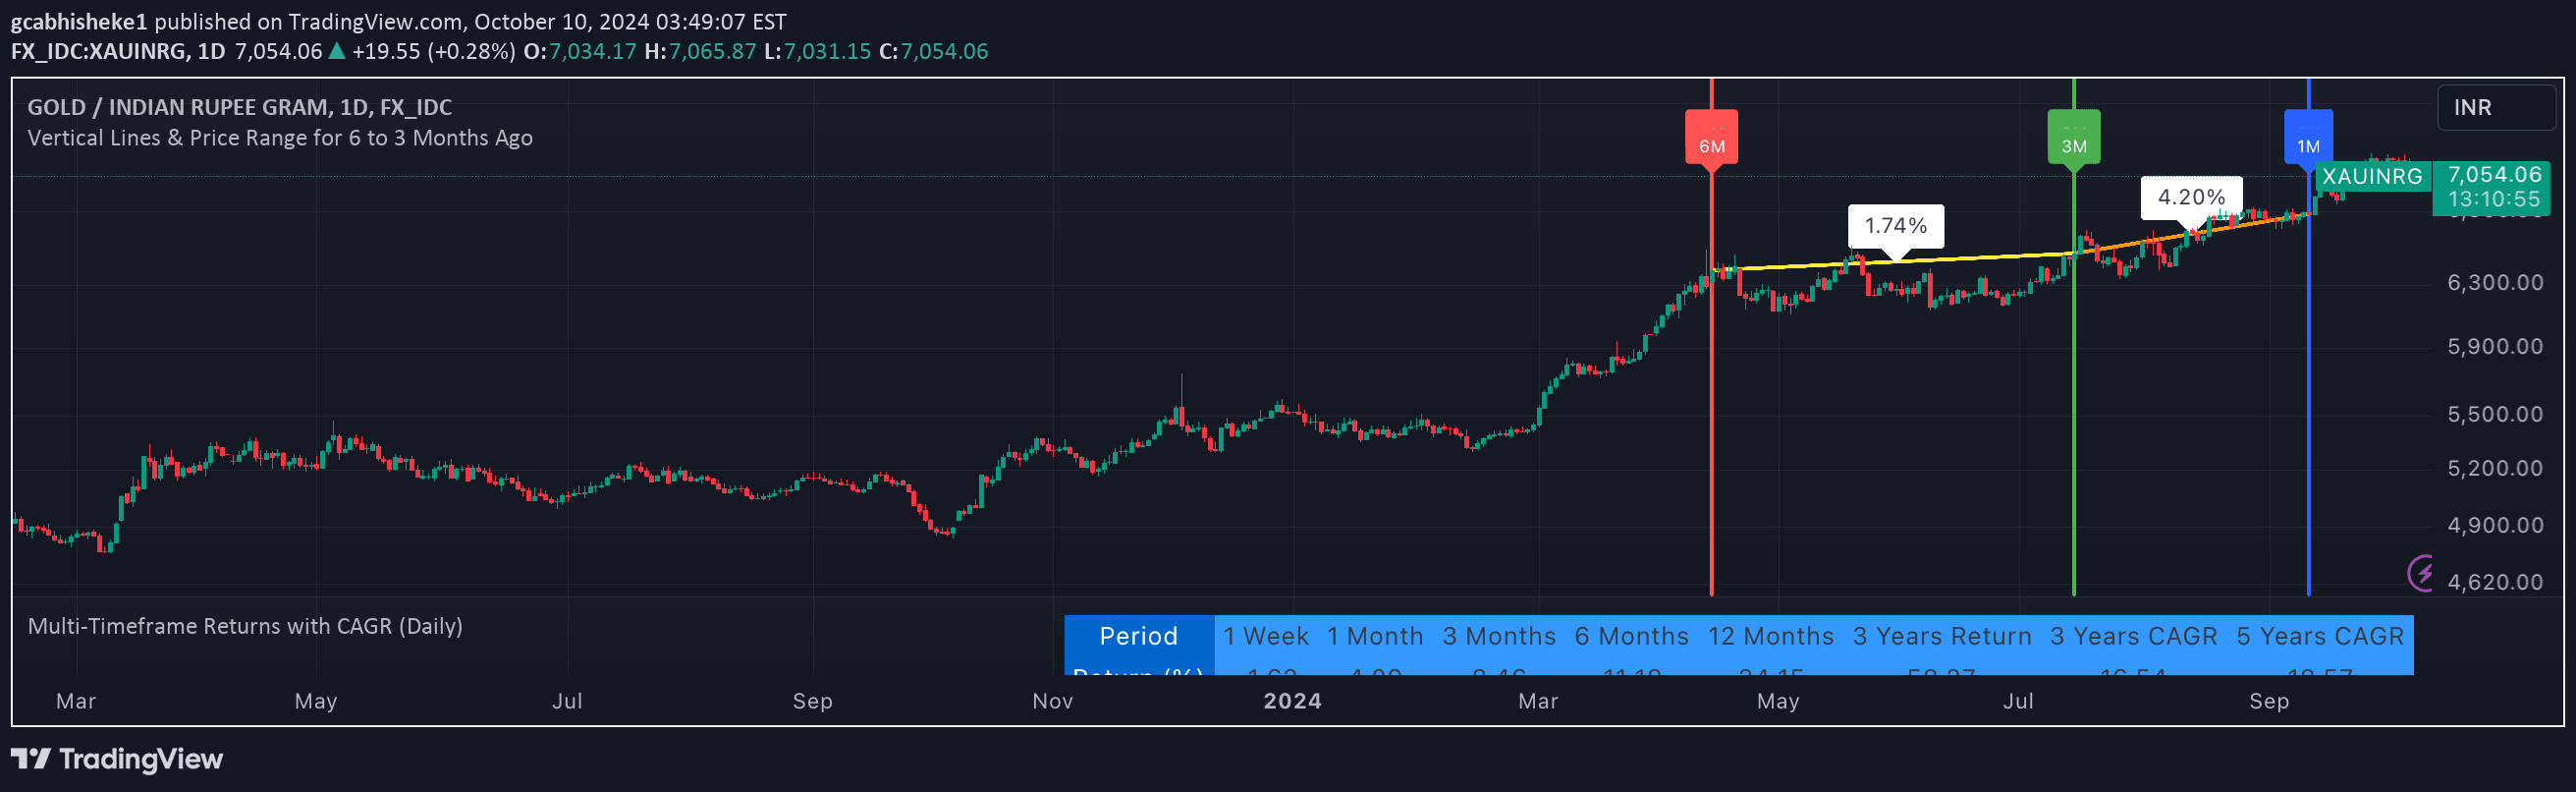
A visual indicator that allows traders to place vertical lines at specific points in price history, helping to mark key events and improve technical analysis understanding.
Explore complementary indicator rolesHow it works
The Vertical Line at N Last Bars script works by enabling traders to strategically place vertical lines on a chart based on a customizable number of recent bars. Users can specify the exact number of past bars they want to highlight, which creates visual markers that help identify significant price action moments or events.
By allowing flexible configuration, the script gives traders the ability to focus on specific timeframes and market segments. The vertical lines serve as immediate visual reference points, making it easier to track and analyze price movements, market transitions, and potential trading opportunities across different market conditions.
Why it may be useful
This indicator matters because it simplifies complex price analysis by providing clear, customizable visual markers that help traders quickly identify important market events and patterns. By highlighting specific bars or moments, traders can more easily recognize potential trend changes, support/resistance levels, and significant price action moments.
The tool enhances technical analysis by offering a straightforward method to mark and remember critical points in market history. Its flexibility allows traders of all skill levels to improve their chart reading abilities, making intricate price movements more comprehensible and actionable.
When to explore it
The Vertical Line at N Last Bars script is most effective when traders need to mark specific historical events, economic data releases, or key market transitions. It works particularly well during periods of high market volatility, where quickly identifying and remembering important price points can provide a strategic advantage.
Traders can leverage this tool across various markets and timeframes, from short-term scalping to longer-term swing trading strategies. It is especially useful when analyzing past market behavior, comparing current price action to historical patterns, and developing a more nuanced understanding of market dynamics.
Keep exploring
What we’ve verified
Access, alerts and repainting behaviour have not been independently verified for this indicator. Check the creator’s current publication and settings.
General descriptions and classifications are recovered research. Verified details above identify the specific checks we have completed. Check the creator’s current publication for later changes.