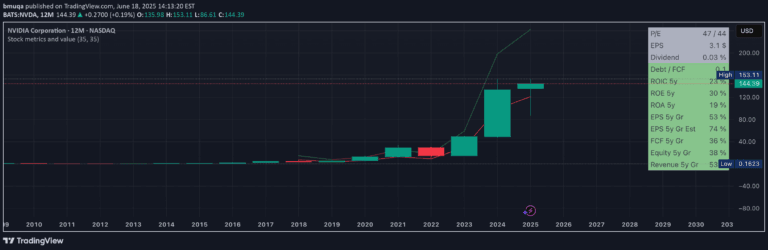
A stock valuation indicator that calculates fair value and margin of safety using historical EPS growth and forward PE estimates for potential investment opportunities.
Explore complementary indicator rolesHow it works
The fair value and margin of safety signal analyzes historical earnings per share (EPS) data over multiple years, typically up to 10 years. It calculates potential future stock value by projecting EPS growth, usually at a standard 15% annual rate, and estimating a forward price-to-earnings (PE) ratio.
Traders can adjust the forward EPS growth percentage and expected future PE to customize the valuation model. The indicator generates two key lines: an upper line representing the fair value of the stock and a lower line showing a margin of safety at 50% of the fair value.
Why it may be useful
This signal provides investors with a structured approach to assessing a stock's intrinsic value beyond current market pricing. By utilizing historical financial data and growth projections, traders can make more informed investment decisions based on fundamental analysis rather than purely speculative market movements.
The margin of safety concept helps investors identify potential undervalued stocks and protect against downside risk. It offers a disciplined method for evaluating investment opportunities by providing a quantitative framework for understanding a stock's potential future value.
When to explore it
The fair value and margin of safety indicator works best when analyzing stocks with consistent historical financial performance and predictable earnings growth. It is most effective when used with a 12-month investment timeframe and stocks that have demonstrated stable earnings patterns over multiple years.
Investors should apply this signal when seeking long-term investment opportunities, particularly for stocks in stable sectors with consistent growth potential. It is particularly useful for value investors and those focused on fundamental analysis who want a systematic approach to identifying potentially undervalued stocks.
Keep exploring
What we’ve verified
Access, alerts and repainting behaviour have not been independently verified for this indicator. Check the creator’s current publication and settings.
General descriptions and classifications are recovered research. Verified details above identify the specific checks we have completed. Check the creator’s current publication for later changes.