
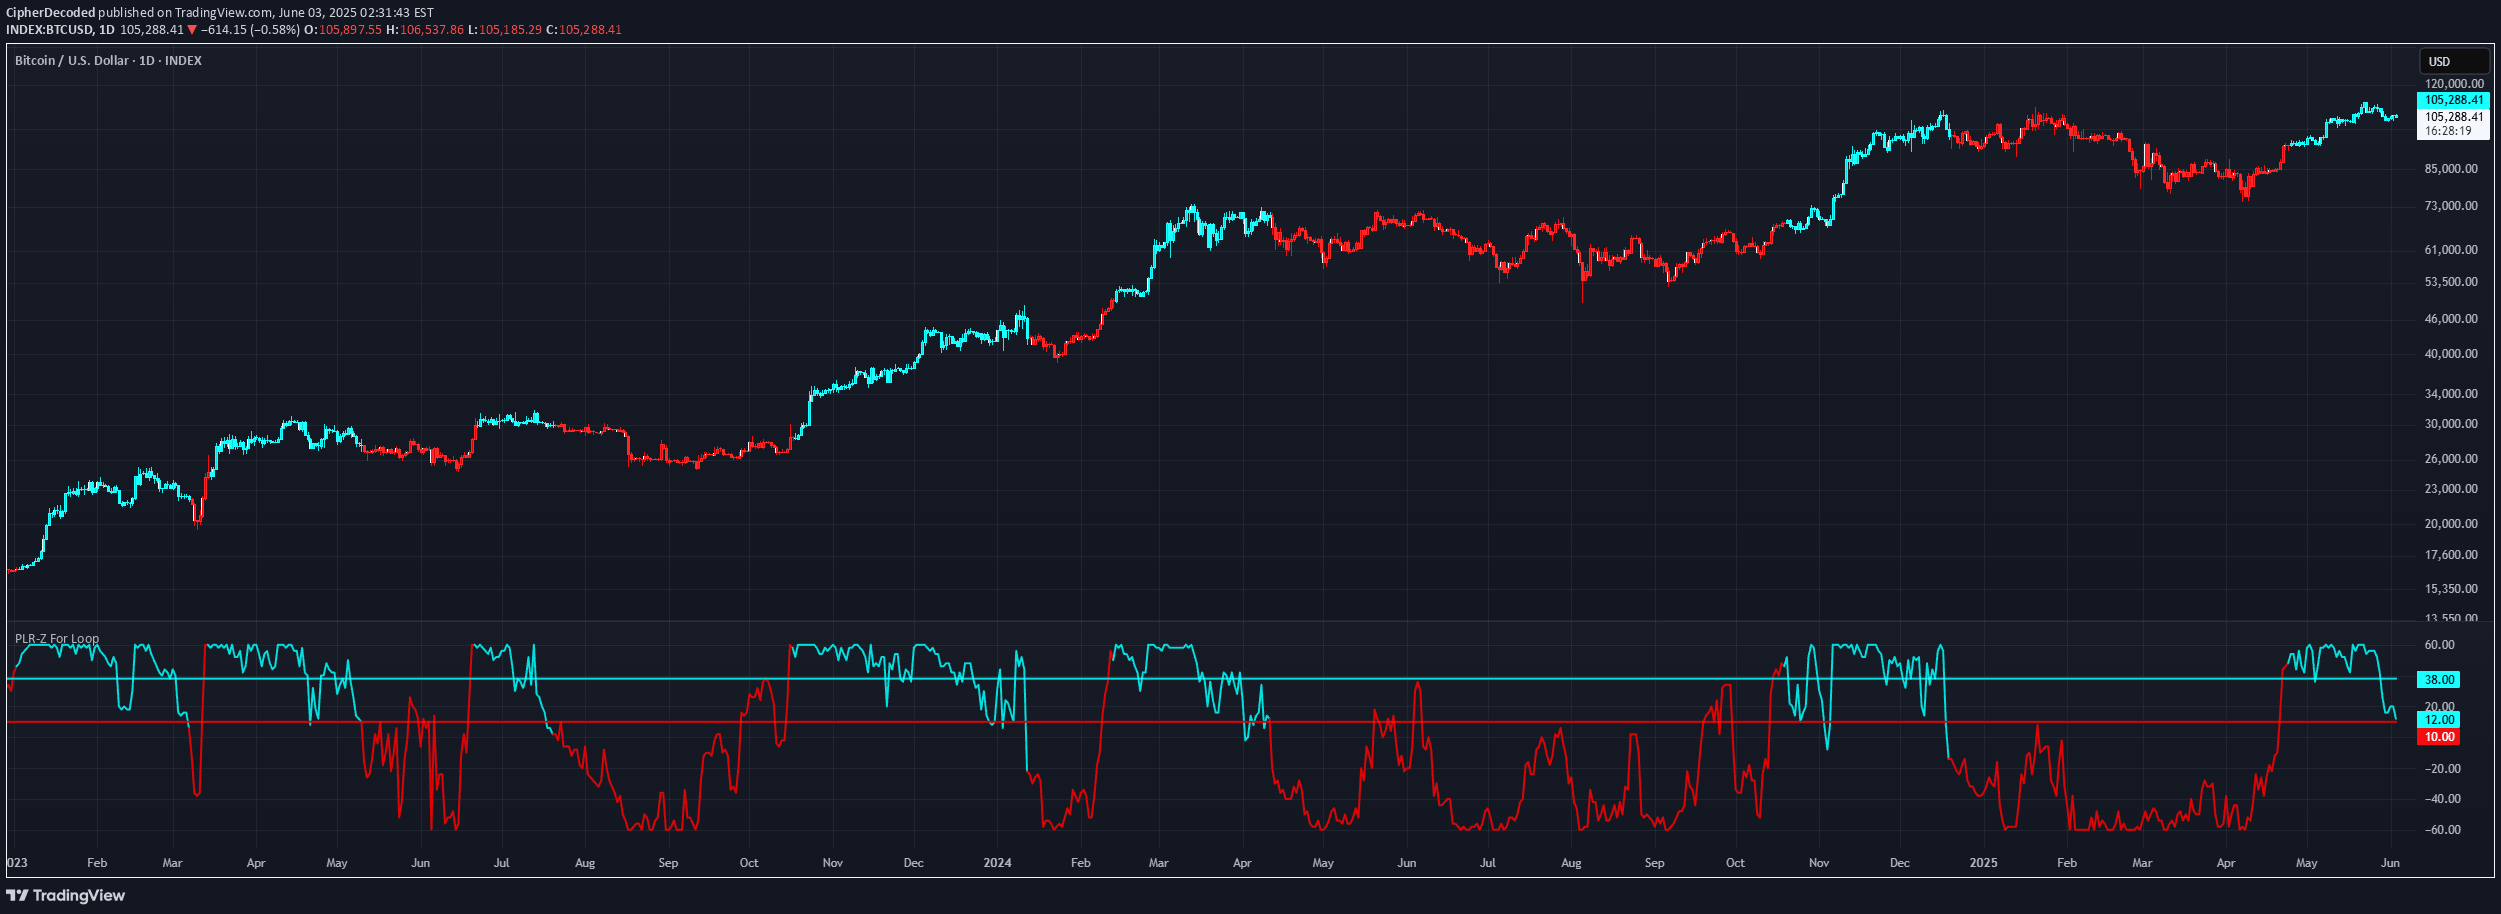
A Bitcoin-specific trend-following indicator that uses power law regression and Z-score normalization to measure price deviations and identify persistent market momentum.
Explore complementary indicator rolesHow it works
The PLR-Z For Loop indicator tracks Bitcoin's price behavior by comparing current price against a long-term logarithmic regression model established from historical data. It calculates the residual difference between the actual price and the power law curve, then normalizes this difference using a rolling mean and standard deviation to create a Z-score.
The indicator then applies a unique loop-based scoring mechanism that compares the current Z-score to previous bars, incrementing or decrementing a trend persistence score. This approach helps identify consistent directional momentum by measuring how often the Z-score exceeds prior values, with optional exponential smoothing to reduce noise in market conditions.
Why it may be useful
This indicator provides traders with a sophisticated method to understand Bitcoin's structural price momentum beyond traditional technical analysis techniques. By leveraging Bitcoin's unique power law price behavior, it offers insights into long-term trend persistence that can help traders differentiate between meaningful directional moves and short-term volatility.
The PLR-Z For Loop shifts focus from simple mean reversion strategies to a more nuanced approach of tracking directional momentum. Its ability to normalize price deviations and score trend consistency makes it a valuable tool for traders seeking high-conviction entry points in Bitcoin's complex market cycles.
When to explore it
The PLR-Z For Loop is most effective for traders focused on macro trend analysis and long-term Bitcoin market participation. It is particularly suited for swing traders and investors who want to align their strategies with Bitcoin's broader structural momentum rather than short-term price fluctuations.
Traders should consider this indicator when seeking to confirm sustained trend movements, filter out market noise, and gain a statistical perspective on Bitcoin's price behavior. It works best on longer timeframes and is specifically calibrated to Bitcoin's historical price evolution, making it less suitable for other assets or shorter-term trading strategies.
Keep exploring
What we’ve verified
Access, alerts and repainting behaviour have not been independently verified for this indicator. Check the creator’s current publication and settings.
General descriptions and classifications are recovered research. Verified details above identify the specific checks we have completed. Check the creator’s current publication for later changes.


