
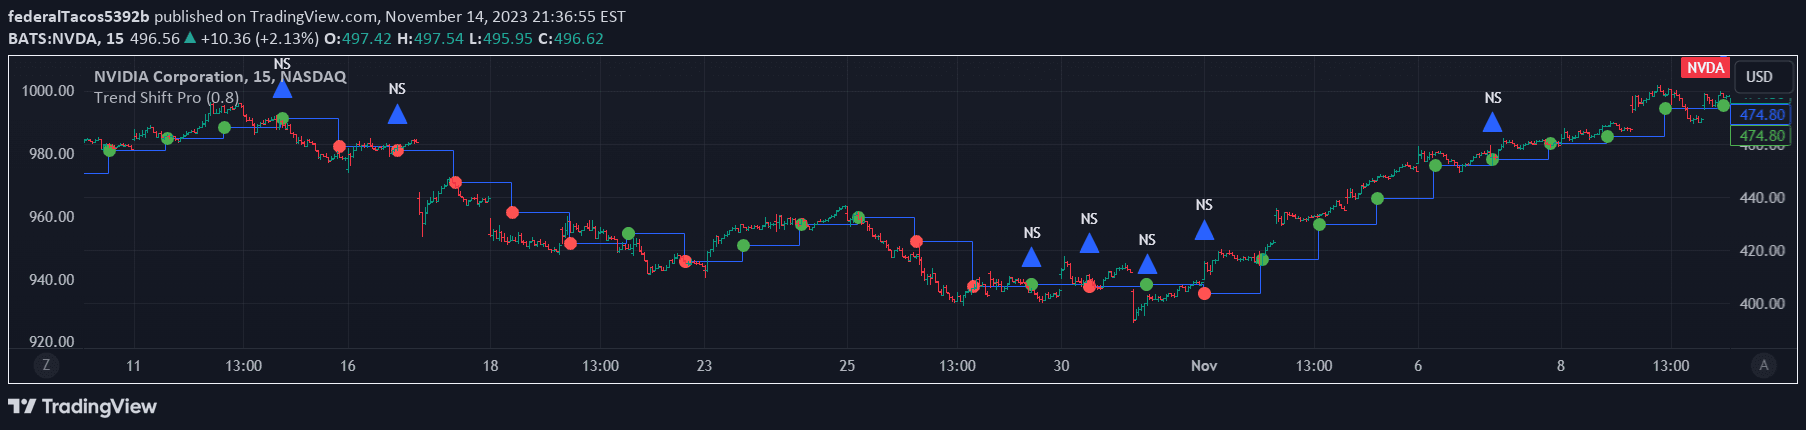
A block-based trend analysis indicator using Median of Means, Interquartile Range, and Cohen's D to identify potential market sentiment shifts and trend changes.
Explore complementary indicator rolesHow it works
The indicator analyzes price data in 21-bar blocks, calculating the Median of Means (MoM) by creating seven subgroups of three bars and finding their median. It then computes the Interquartile Range (IQR) to measure price dispersion within each block, providing insights into price variability.
A non-parametric Cohen's D is calculated to compare MoM values between consecutive blocks, helping identify significant shifts in market dynamics. The method uses raw price data without smoothing, focusing on direct block-to-block comparisons to detect potential trend changes and market sentiment transitions.
Why it may be useful
This indicator offers traders a robust method for identifying market trend changes by using advanced statistical techniques that are less susceptible to outliers and extreme values. By breaking down price data into blocks and analyzing central tendencies, it provides a more nuanced view of market movements compared to traditional trend indicators.
The combination of Median of Means, Interquartile Range, and Cohen's D allows traders to detect subtle shifts in market sentiment that might be missed by simpler trend-following tools. This approach helps traders make more informed decisions by highlighting potential trend reversals with greater statistical reliability.
When to explore it
The indicator is most effective in markets with clear directional movements and when traders want to identify potential trend changes with statistical precision. It works best in timeframes that allow for meaningful block analysis, such as daily or hourly charts where 21-bar blocks can capture significant market cycles.
Traders should use this indicator in conjunction with other technical and fundamental analysis tools, as it provides a sophisticated statistical perspective on market trends. It is particularly useful in markets with moderate volatility, where subtle shifts in momentum can signal important trend transitions.
Keep exploring
What we’ve verified
Access, alerts and repainting behaviour have not been independently verified for this indicator. Check the creator’s current publication and settings.
General descriptions and classifications are recovered research. Verified details above identify the specific checks we have completed. Check the creator’s current publication for later changes.


