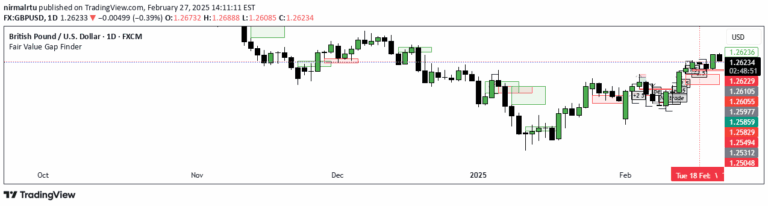
A trading indicator that identifies price gaps representing market imbalances, highlighting potential support and resistance zones through dynamic color-coded visual representation.
Explore complementary indicator rolesHow it works
The Fair Value Gap indicator identifies market imbalances by detecting specific price discontinuities between consecutive candles. For bullish gaps, it looks for situations where the high of three previous candles is lower than the low of the next candle, while bearish gaps occur when the low of three previous candles is higher than the high of the next candle.
Once an FVG is identified, the indicator visually marks these zones using distinct colors: green for unmitigated bullish gaps and red for unmitigated bearish gaps. When price touches or partially fills these gaps, the colors dynamically change to yellow-green for bullish and purple for bearish, providing real-time visual feedback about the gap's status.
Why it may be useful
Fair Value Gaps are crucial because they reveal significant market imbalances that often represent areas of potential price attraction and liquidity. By highlighting these zones, traders can identify potential support and resistance levels that institutional traders might be watching, providing insights into potential price movements and market sentiment.
The dynamic color-coding helps traders quickly understand the current status of these gaps, making it easier to track market behavior and potential trading opportunities. These gaps often represent areas where significant trading activity might occur, offering traders a strategic tool for understanding market dynamics and potential entry or exit points.
When to explore it
Fair Value Gap indicators work best in markets with clear price movements and sufficient liquidity, such as major forex pairs, stock indices, and high-volume commodities. They are particularly effective in identifying potential reversal or continuation zones where price might seek liquidity or balance previous market imbalances.
Traders should use this indicator in conjunction with other technical analysis tools to confirm signals and reduce false positives. The most reliable signals occur in trending markets where price is more likely to respect these identified gaps and when multiple timeframes show consistent gap formations.
Keep exploring
What we’ve verified
Access, alerts and repainting behaviour have not been independently verified for this indicator. Check the creator’s current publication and settings.
General descriptions and classifications are recovered research. Verified details above identify the specific checks we have completed. Check the creator’s current publication for later changes.