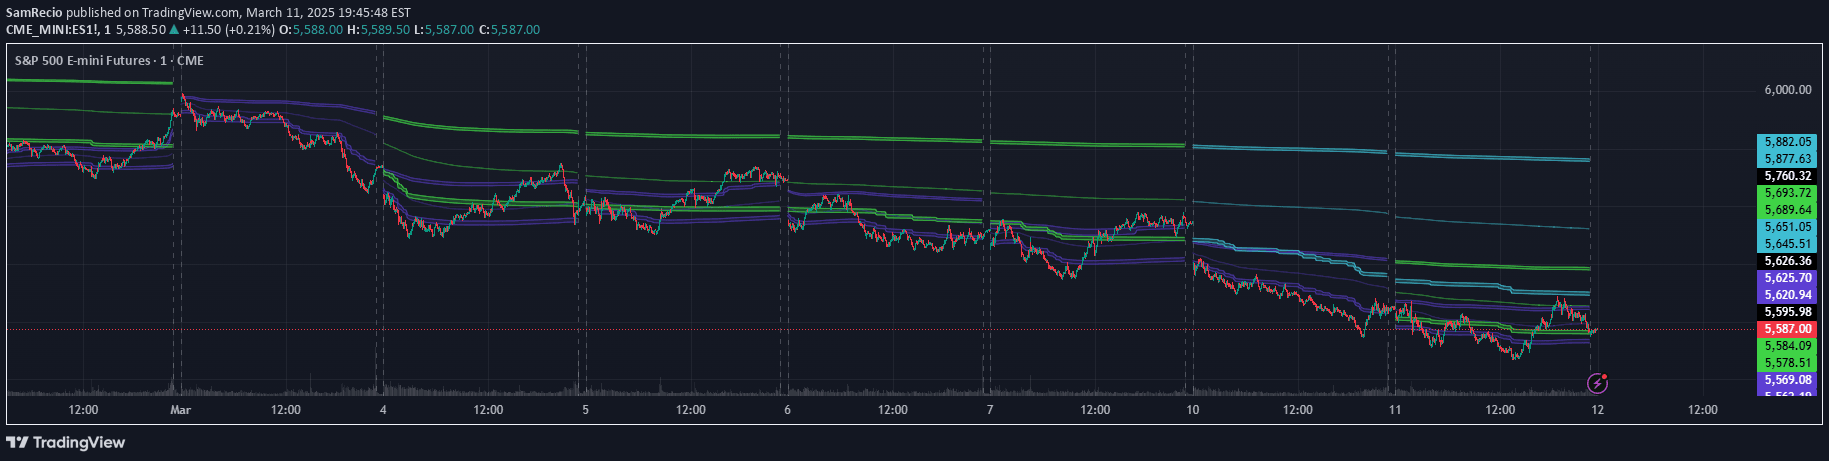
A technical analysis tool that identifies market sentiment shifts between fear and greed zones using moving averages and standard deviation calculations to detect potential reversal points.
Explore complementary indicator rolesHow it works
The Fear/Greed Zone Reversals indicator calculates market sentiment by analyzing price deviation from selected moving averages. It uses different moving average types like SMA, EMA, and HMA to create flexible calculations for fear and greed zones.
The indicator tracks price movements relative to the chosen moving average, identifying significant deviations above or below the baseline. By measuring these deviations using standard deviation periods, the tool highlights potential reversal points where market sentiment transitions between extreme fear and greed states.
Why it may be useful
This indicator provides traders with a nuanced view of market psychology by quantifying sentiment shifts through mathematical calculations. It helps traders identify potential entry and exit points by revealing when markets might be transitioning from oversold or overbought conditions.
By offering multiple moving average types, the tool adapts to different market conditions and trading styles. Traders can gain insights into potential trend reversals, making it a versatile tool for understanding market dynamics and sentiment-driven price movements.
When to explore it
The Fear/Greed Zone Reversals indicator works best in markets with clear trending characteristics and significant price volatility. It is particularly effective when traders want to identify potential trend reversals and sentiment shifts across various timeframes and asset classes.
Traders should use this indicator in conjunction with other technical analysis tools and fundamental research. It is most valuable when markets demonstrate extreme sentiment conditions, helping traders recognize potential turning points and make more informed trading decisions.
Keep exploring
What we’ve verified
Access, alerts and repainting behaviour have not been independently verified for this indicator. Check the creator’s current publication and settings.
General descriptions and classifications are recovered research. Verified details above identify the specific checks we have completed. Check the creator’s current publication for later changes.