
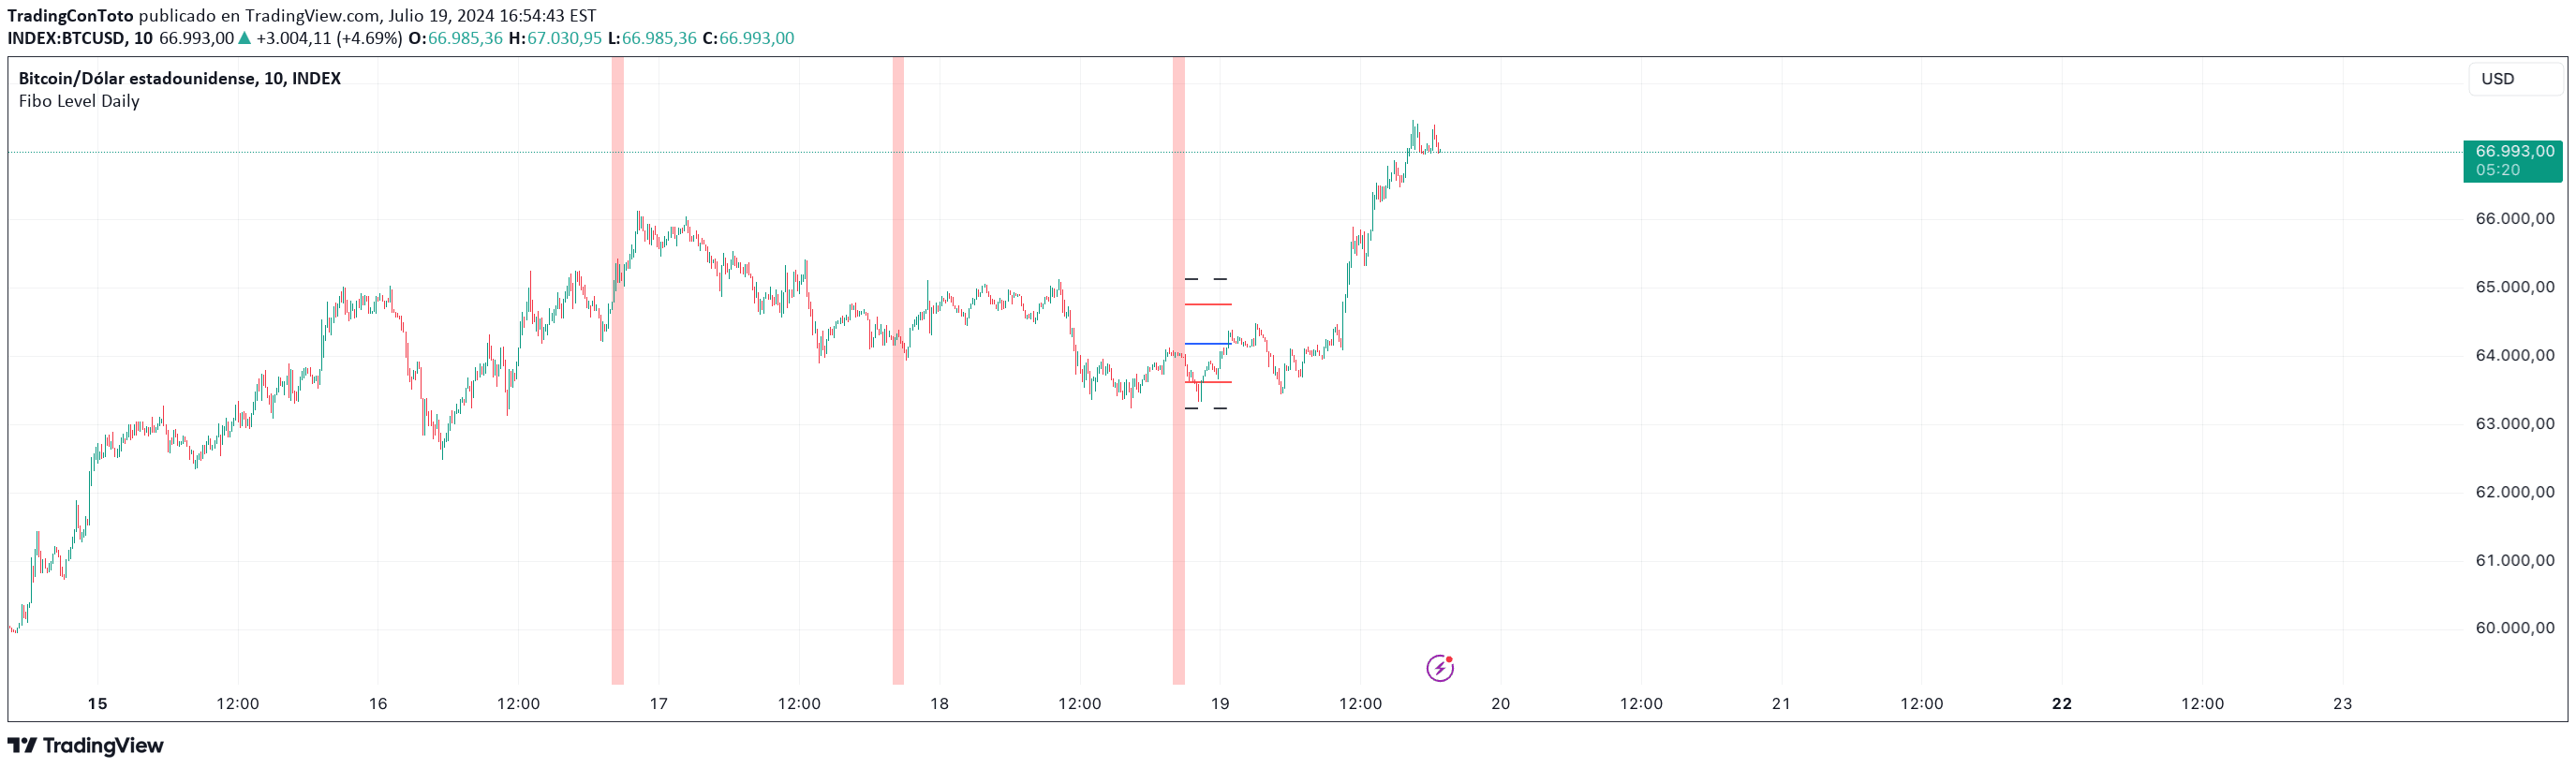
A Bitcoin trading strategy using Fibonacci levels calculated from the previous day's price range to determine entry and exit points based on daily candle trend direction.
Explore complementary indicator rolesHow it works
The strategy calculates three Fibonacci levels (0.8, 0.5, and 0.2) based on the previous day's high and low prices. These levels are derived by multiplying the price range by specific percentages and adding them to the previous day's low point, creating reference lines on the chart.
The indicator first determines the previous day's trend by checking whether the daily candle closed bullish or bearish. For a bearish candle, traders wait for price to rise to the 0.5 level to enter a sell position, with a take profit at the 0.2 level. Conversely, for a bullish candle, traders wait for price to drop to the 0.5 level to enter a buy position, with a take profit at the 0.8 level.
Why it may be useful
This strategy provides traders with a systematic approach to identifying potential entry and exit points based on the previous day's price action. By using Fibonacci levels, traders can make more informed decisions about market movements, utilizing a mathematical framework that helps predict potential support and resistance zones.
The method offers a clear, rule-based trading approach that removes emotional decision-making from the trading process. It provides visual cues through horizontal lines and helps traders understand market dynamics by analyzing the previous day's price behavior and potential future movement patterns.
When to explore it
The Fibonacci Level Daily strategy works best in trending markets with clear directional movements, particularly for Bitcoin trading on the 1-hour timeframe. It is most effective when market volatility is moderate and price action shows consistent patterns around the calculated Fibonacci levels.
Traders should apply this strategy during periods of stable market conditions and avoid using it during extreme market volatility or during major news events that could dramatically disrupt price patterns. The strategy is particularly suited for traders who prefer a structured approach to market analysis and want to make trading decisions based on mathematical levels derived from recent price history.
Keep exploring
What we’ve verified
Access, alerts and repainting behaviour have not been independently verified for this indicator. Check the creator’s current publication and settings.
General descriptions and classifications are recovered research. Verified details above identify the specific checks we have completed. Check the creator’s current publication for later changes.


