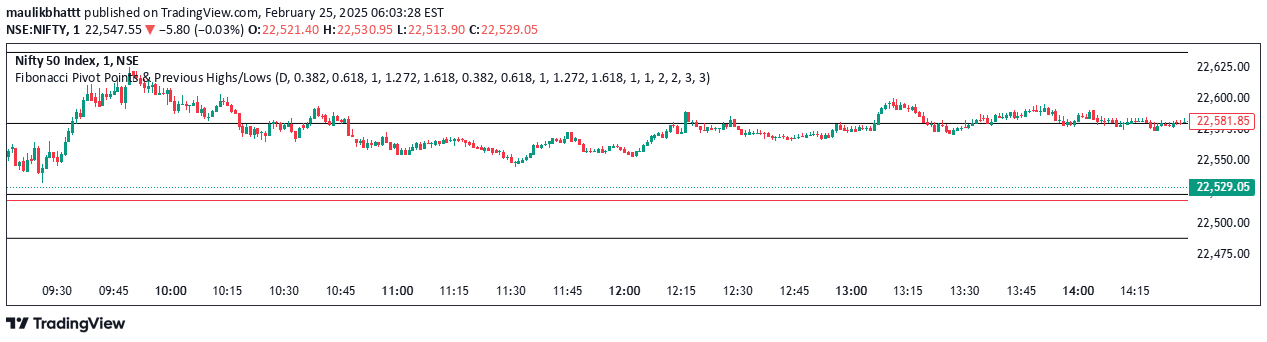
Fibonacci pivots combine pivot points and Fibonacci retracement levels to identify potential support and resistance zones in trading, helping predict price movement based on mathematical ratios.
Explore complementary indicator rolesHow it works
Fibonacci pivots start by calculating a central pivot point using the average of the previous period's high, low, and close prices. This pivot point becomes the reference for generating support and resistance levels by applying key Fibonacci ratios like 38.2%, 61.8%, and 100% to the price range.
The method creates multiple support (S1, S2, S3) and resistance (R1, R2, R3) levels by adding or subtracting Fibonacci-based calculations from the pivot point. These levels help traders identify potential price reversal or continuation zones based on mathematical retracement principles.
Why it may be useful
Fibonacci pivots provide traders with a structured approach to understanding potential price movement by leveraging mathematical relationships in market dynamics. They offer a systematic method for identifying key support and resistance levels that can help predict potential trend reversals or continuations.
By combining pivot point calculations with Fibonacci ratios, these levels offer more precise and mathematically-grounded insights compared to traditional support and resistance analysis. Traders can use these levels to make more informed decisions about entry, exit, and stop-loss strategies.
When to explore it
Fibonacci pivots work best in markets with clear trending or ranging characteristics, particularly in liquid and volatile financial instruments like forex, stocks, and futures. They are most effective when used in conjunction with other technical analysis tools and during periods of consistent price movement.
Traders should apply Fibonacci pivots on daily, hourly, or shorter timeframes to capture short to medium-term price movements. They are particularly useful during market sessions with high liquidity and when trading instruments that tend to respect mathematical retracement levels.
Keep exploring
What we’ve verified
Access, alerts and repainting behaviour have not been independently verified for this indicator. Check the creator’s current publication and settings.
General descriptions and classifications are recovered research. Verified details above identify the specific checks we have completed. Check the creator’s current publication for later changes.