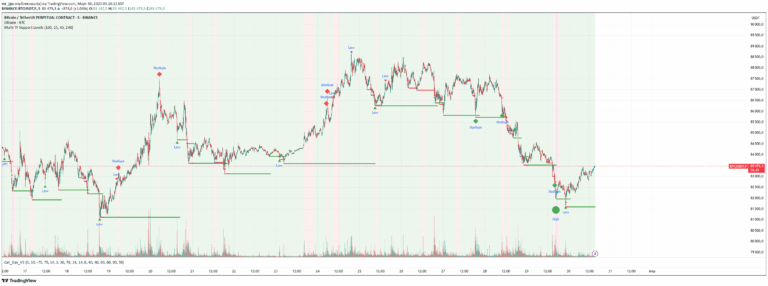
A dynamic Fibonacci retracement tool that identifies potential trend reversals by plotting key levels and providing real-time trend analysis for traders.
Explore complementary indicator rolesHow it works
The Fibonacci Repulse indicator calculates retracement levels between the highest high and lowest low within a user-defined period, drawing extended lines at 23.6%, 38.2%, and 50% levels. These levels dynamically update as the chart moves, providing a flexible framework for tracking potential price reversals and momentum shifts.
When price touches a Fibonacci level and closes above it, the indicator generates a 'Bullish Retest' label, signaling a potential buying opportunity. Simultaneously, it populates a real-time trend status table in the chart's bottom-right corner, automatically categorizing the market trend as Bullish, Bearish, or Sideways based on the price's relationship to the Fibonacci levels.
Why it may be useful
The Fibonacci Repulse indicator provides traders with a sophisticated visual tool for understanding market dynamics, offering precise insights into potential trend reversals and momentum shifts. By combining Fibonacci retracement levels with dynamic trend detection, traders can make more informed decisions about market entry and exit points.
This tool bridges the gap between complex mathematical analysis and practical trading strategies, presenting complex price action information in an easily digestible format. Its real-time trend detection and retracement level visualization help traders quickly assess market conditions, reducing the cognitive load of manual trend analysis and providing actionable trading signals.
When to explore it
The Fibonacci Repulse indicator is most effective in markets with clear trending behavior, where price tends to respect Fibonacci retracement levels and show predictable momentum patterns. It works exceptionally well in liquid markets like forex, major stock indices, and cryptocurrencies, where price movements are more likely to follow technical analysis principles.
Traders should utilize this indicator during periods of moderate to high market volatility, where price has demonstrated recent swing highs and lows. It is particularly useful when combined with other technical indicators, helping to confirm trend reversals, identify potential entry and exit points, and provide additional context to trading decisions across different timeframes.
Keep exploring
What we’ve verified
Access, alerts and repainting behaviour have not been independently verified for this indicator. Check the creator’s current publication and settings.
General descriptions and classifications are recovered research. Verified details above identify the specific checks we have completed. Check the creator’s current publication for later changes.