
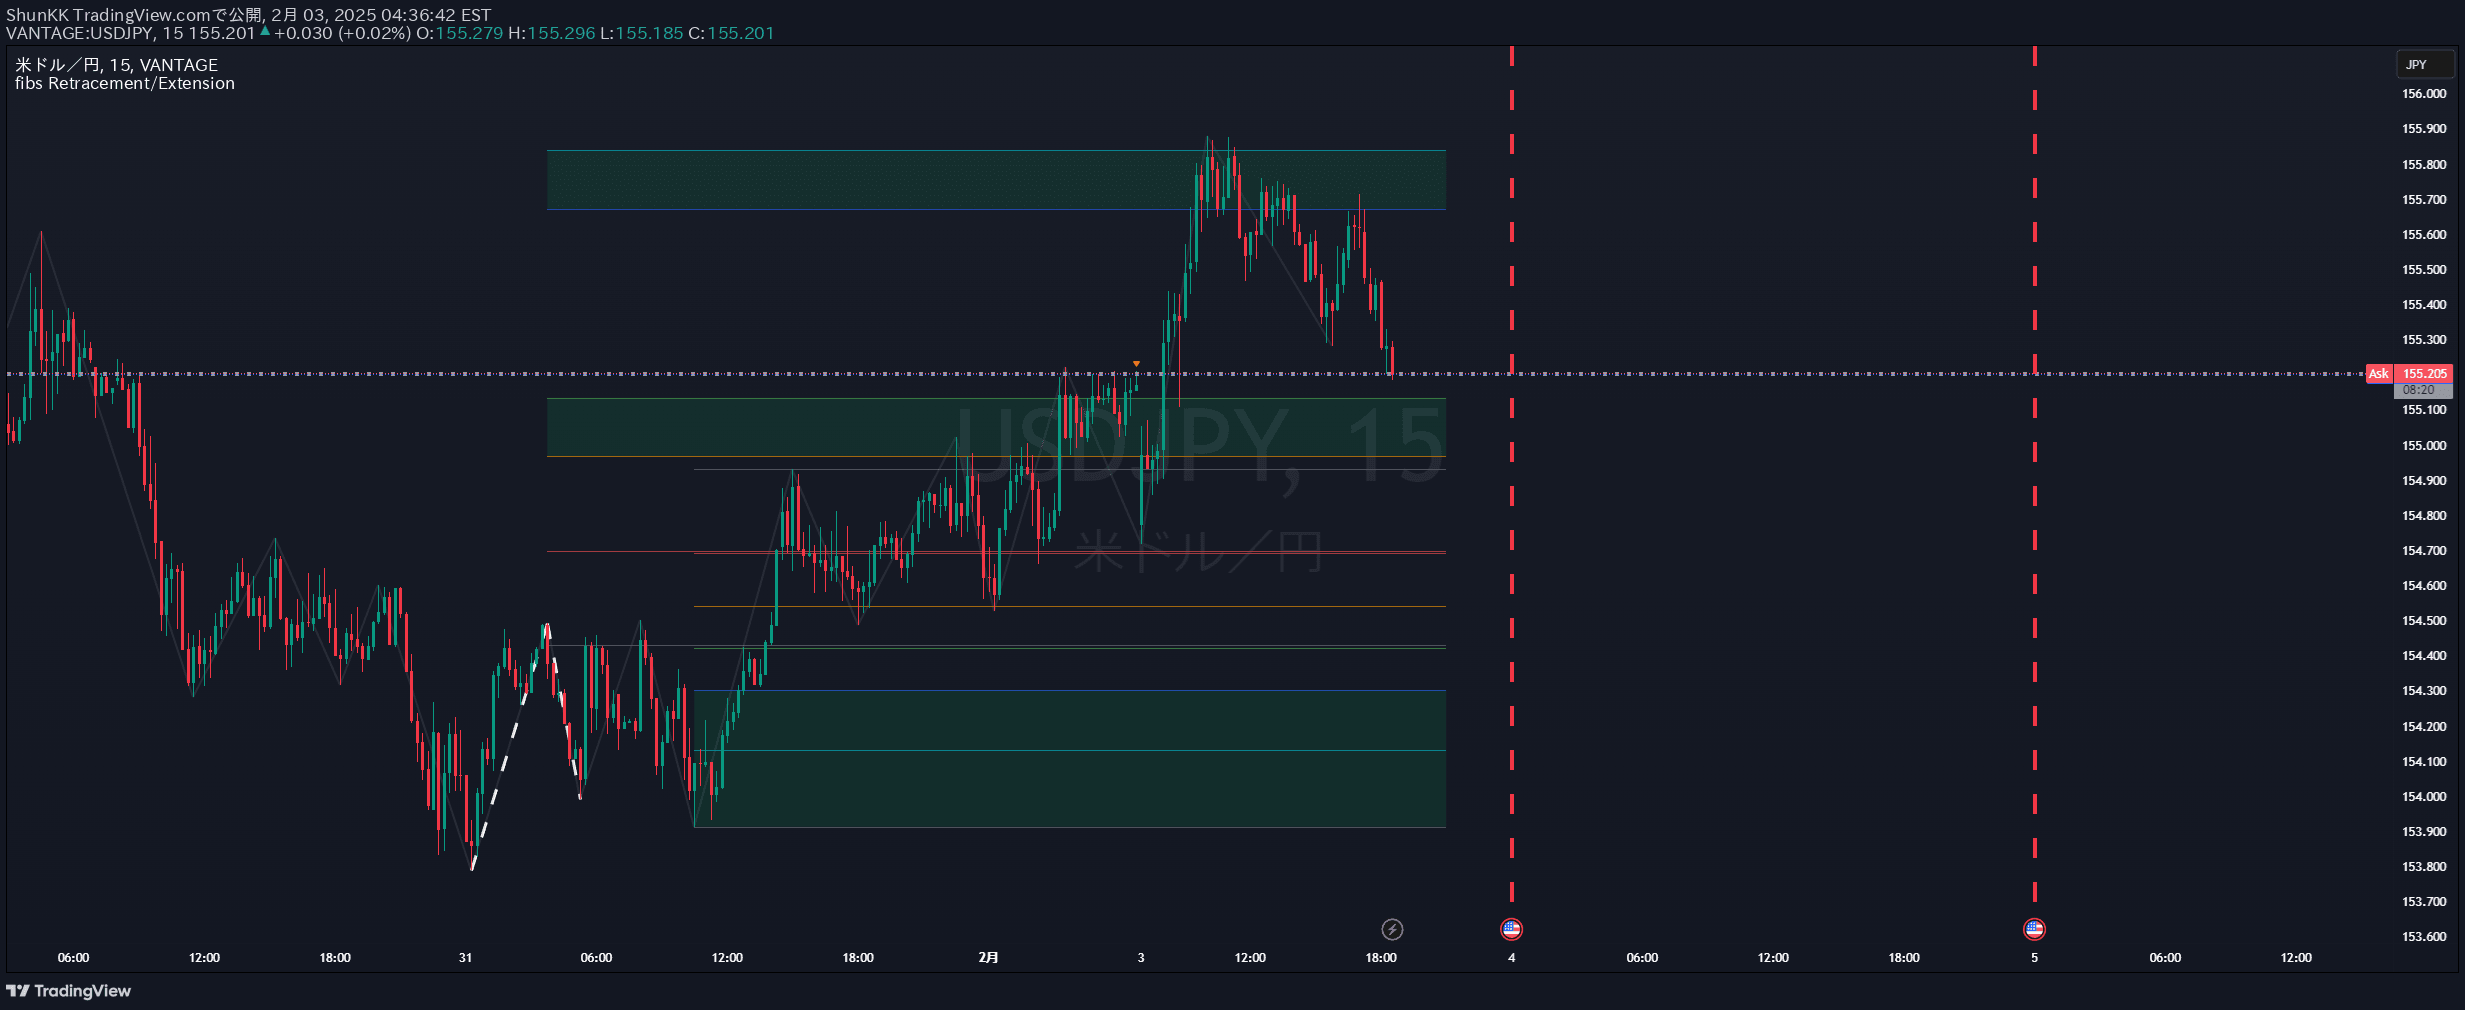
A Fibonacci-based indicator that identifies swing highs and lows to calculate retracement and extension levels for trend analysis and potential price targets.
Explore complementary indicator rolesHow it works
The Fibonacci indicator uses a ZigZag algorithm to detect significant swing highs and lows in price movement. By identifying these key points, it calculates predefined Fibonacci ratios including 0.236, 0.382, 0.5, 0.618, 0.786, and 1.0 to create retracement and extension levels.
These levels are dynamically plotted on the chart, allowing traders to visualize potential support and resistance zones. The indicator adjusts its calculations based on the current trend direction, which can be configured as bullish, bearish, or neutral, providing a flexible tool for trend analysis.
Why it may be useful
Fibonacci levels provide traders with strategic insights into potential price reversal and continuation zones based on mathematical ratios observed in market movements. By identifying key retracement and extension levels, traders can make more informed decisions about entry and exit points.
The indicator helps traders understand market psychology and potential price targets by leveraging historical price action patterns. It offers a systematic approach to identifying potential support and resistance levels, which can be crucial for risk management and trade planning.
When to explore it
The Fibonacci indicator is most effective in trending markets with clear directional movement, where price tends to respect key retracement levels. It works best when used in conjunction with other technical analysis tools to confirm potential trading signals and validate price action.
Traders should be particularly attentive to this indicator during periods of market volatility or when analyzing longer-term price trends. It is especially useful for swing traders and day traders looking to identify potential entry and exit points based on mathematically derived levels.
Keep exploring
What we’ve verified
Access, alerts and repainting behaviour have not been independently verified for this indicator. Check the creator’s current publication and settings.
General descriptions and classifications are recovered research. Verified details above identify the specific checks we have completed. Check the creator’s current publication for later changes.


