
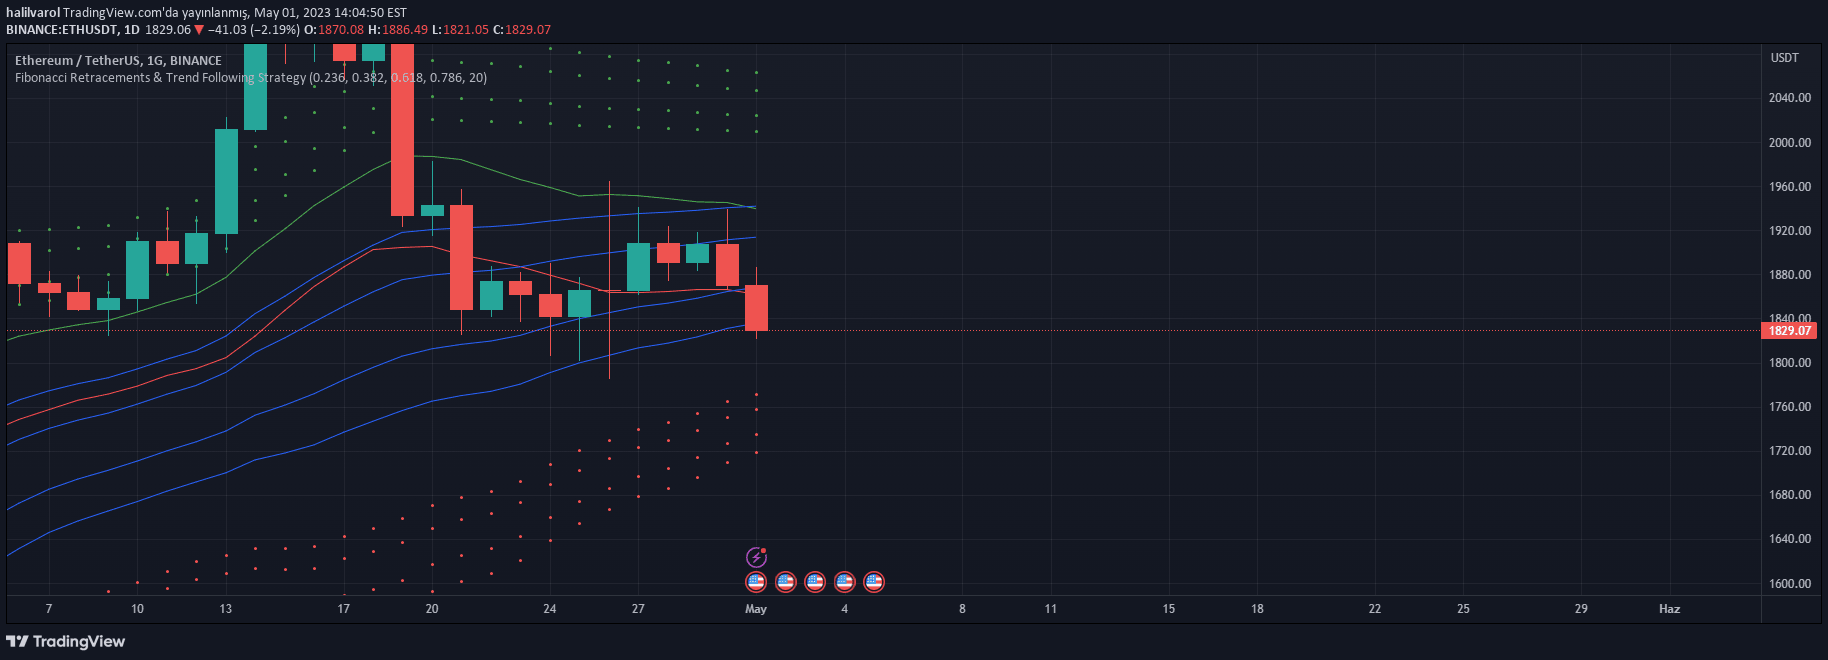
A technical analysis tool using Fibonacci retracement levels and trend-following indicators to identify potential price reversals, entry points, and target levels in trading.
Explore complementary indicator rolesHow it works
The Fibonacci retracement indicator calculates specific price levels based on key Fibonacci ratios (0.236, 0.382, 0.618, 0.786) applied to a price trend's high and low points. These levels represent potential areas of price retracement or consolidation where traders might expect price movement to pause or reverse.
The indicator combines these Fibonacci levels with a trend-following component that tracks average high and low prices over a specific period. By analyzing the interaction between the trend indicator and Fibonacci levels, traders can identify potential entry and exit points, helping them make more informed trading decisions.
Why it may be useful
Fibonacci retracement provides traders with a mathematically-based method for identifying potential support and resistance levels, which can help predict price movements and manage risk more effectively. These levels are based on natural mathematical relationships that often reflect market psychology and trader behavior.
By offering a structured approach to identifying potential price reversals and trend continuation points, the Fibonacci retracement indicator helps traders make more disciplined and strategic trading decisions. It provides a systematic framework for understanding market dynamics and potential price action.
When to explore it
The Fibonacci retracement indicator works best in markets with clear trending behavior, where prices are showing consistent directional movement either upward or downward. It is particularly effective in liquid markets like forex, stocks, and major commodities where price movements tend to be more predictable.
Traders should use this indicator in conjunction with other technical analysis tools to confirm signals and reduce false positives. It is most reliable when used across multiple timeframes and when combined with volume analysis, trend indicators, and other confirmation mechanisms.
Keep exploring
What we’ve verified
Access, alerts and repainting behaviour have not been independently verified for this indicator. Check the creator’s current publication and settings.
General descriptions and classifications are recovered research. Verified details above identify the specific checks we have completed. Check the creator’s current publication for later changes.


