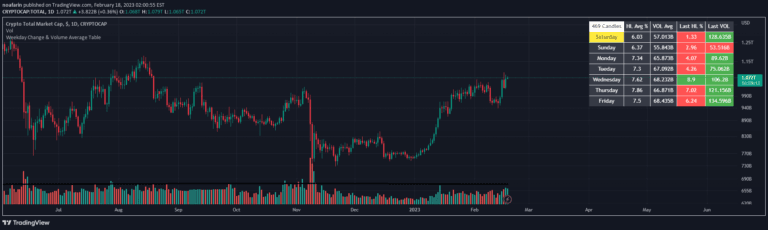
A compact trading tool displaying real-time stock metrics including float, daily and intraday price changes, and short volume percentage for quick market insights.
Explore complementary indicator rolesHow it works
The script generates a small table overlay on the TradingView chart that automatically calculates and displays four key stock metrics in real-time. It tracks the publicly available float, calculating the daily percentage change by comparing yesterday's closing price to the current price.
Additionally, the indicator computes the intraday percentage change from today's opening price and estimates the short volume as a percentage of total daily trading volume. The table updates dynamically on the latest candle, providing traders with instant, current market information.
Why it may be useful
This signal provides traders with critical market information at a glance, eliminating the need to switch between multiple screens or data sources. By consolidating essential metrics like float, price changes, and short volume, traders can quickly assess a stock's current market dynamics and potential momentum.
The real-time updates and compact display make it an invaluable tool for active traders who need to make rapid decisions based on current market conditions. It offers transparency into trading volume, price movement, and short selling activity, which can be crucial for identifying potential trading opportunities.
When to explore it
This tool is most effective for momentum traders, day traders, and those tracking short interest in specific stocks. It's particularly useful during volatile market conditions when rapid information gathering can provide a competitive edge in decision-making.
Traders should utilize this signal when they want to quickly understand a stock's current trading characteristics, especially when monitoring potential short squeeze opportunities or assessing intraday price dynamics. It's ideal for stocks with significant trading volume and those experiencing notable price movements.
Keep exploring
What we’ve verified
Access, alerts and repainting behaviour have not been independently verified for this indicator. Check the creator’s current publication and settings.
General descriptions and classifications are recovered research. Verified details above identify the specific checks we have completed. Check the creator’s current publication for later changes.